
|
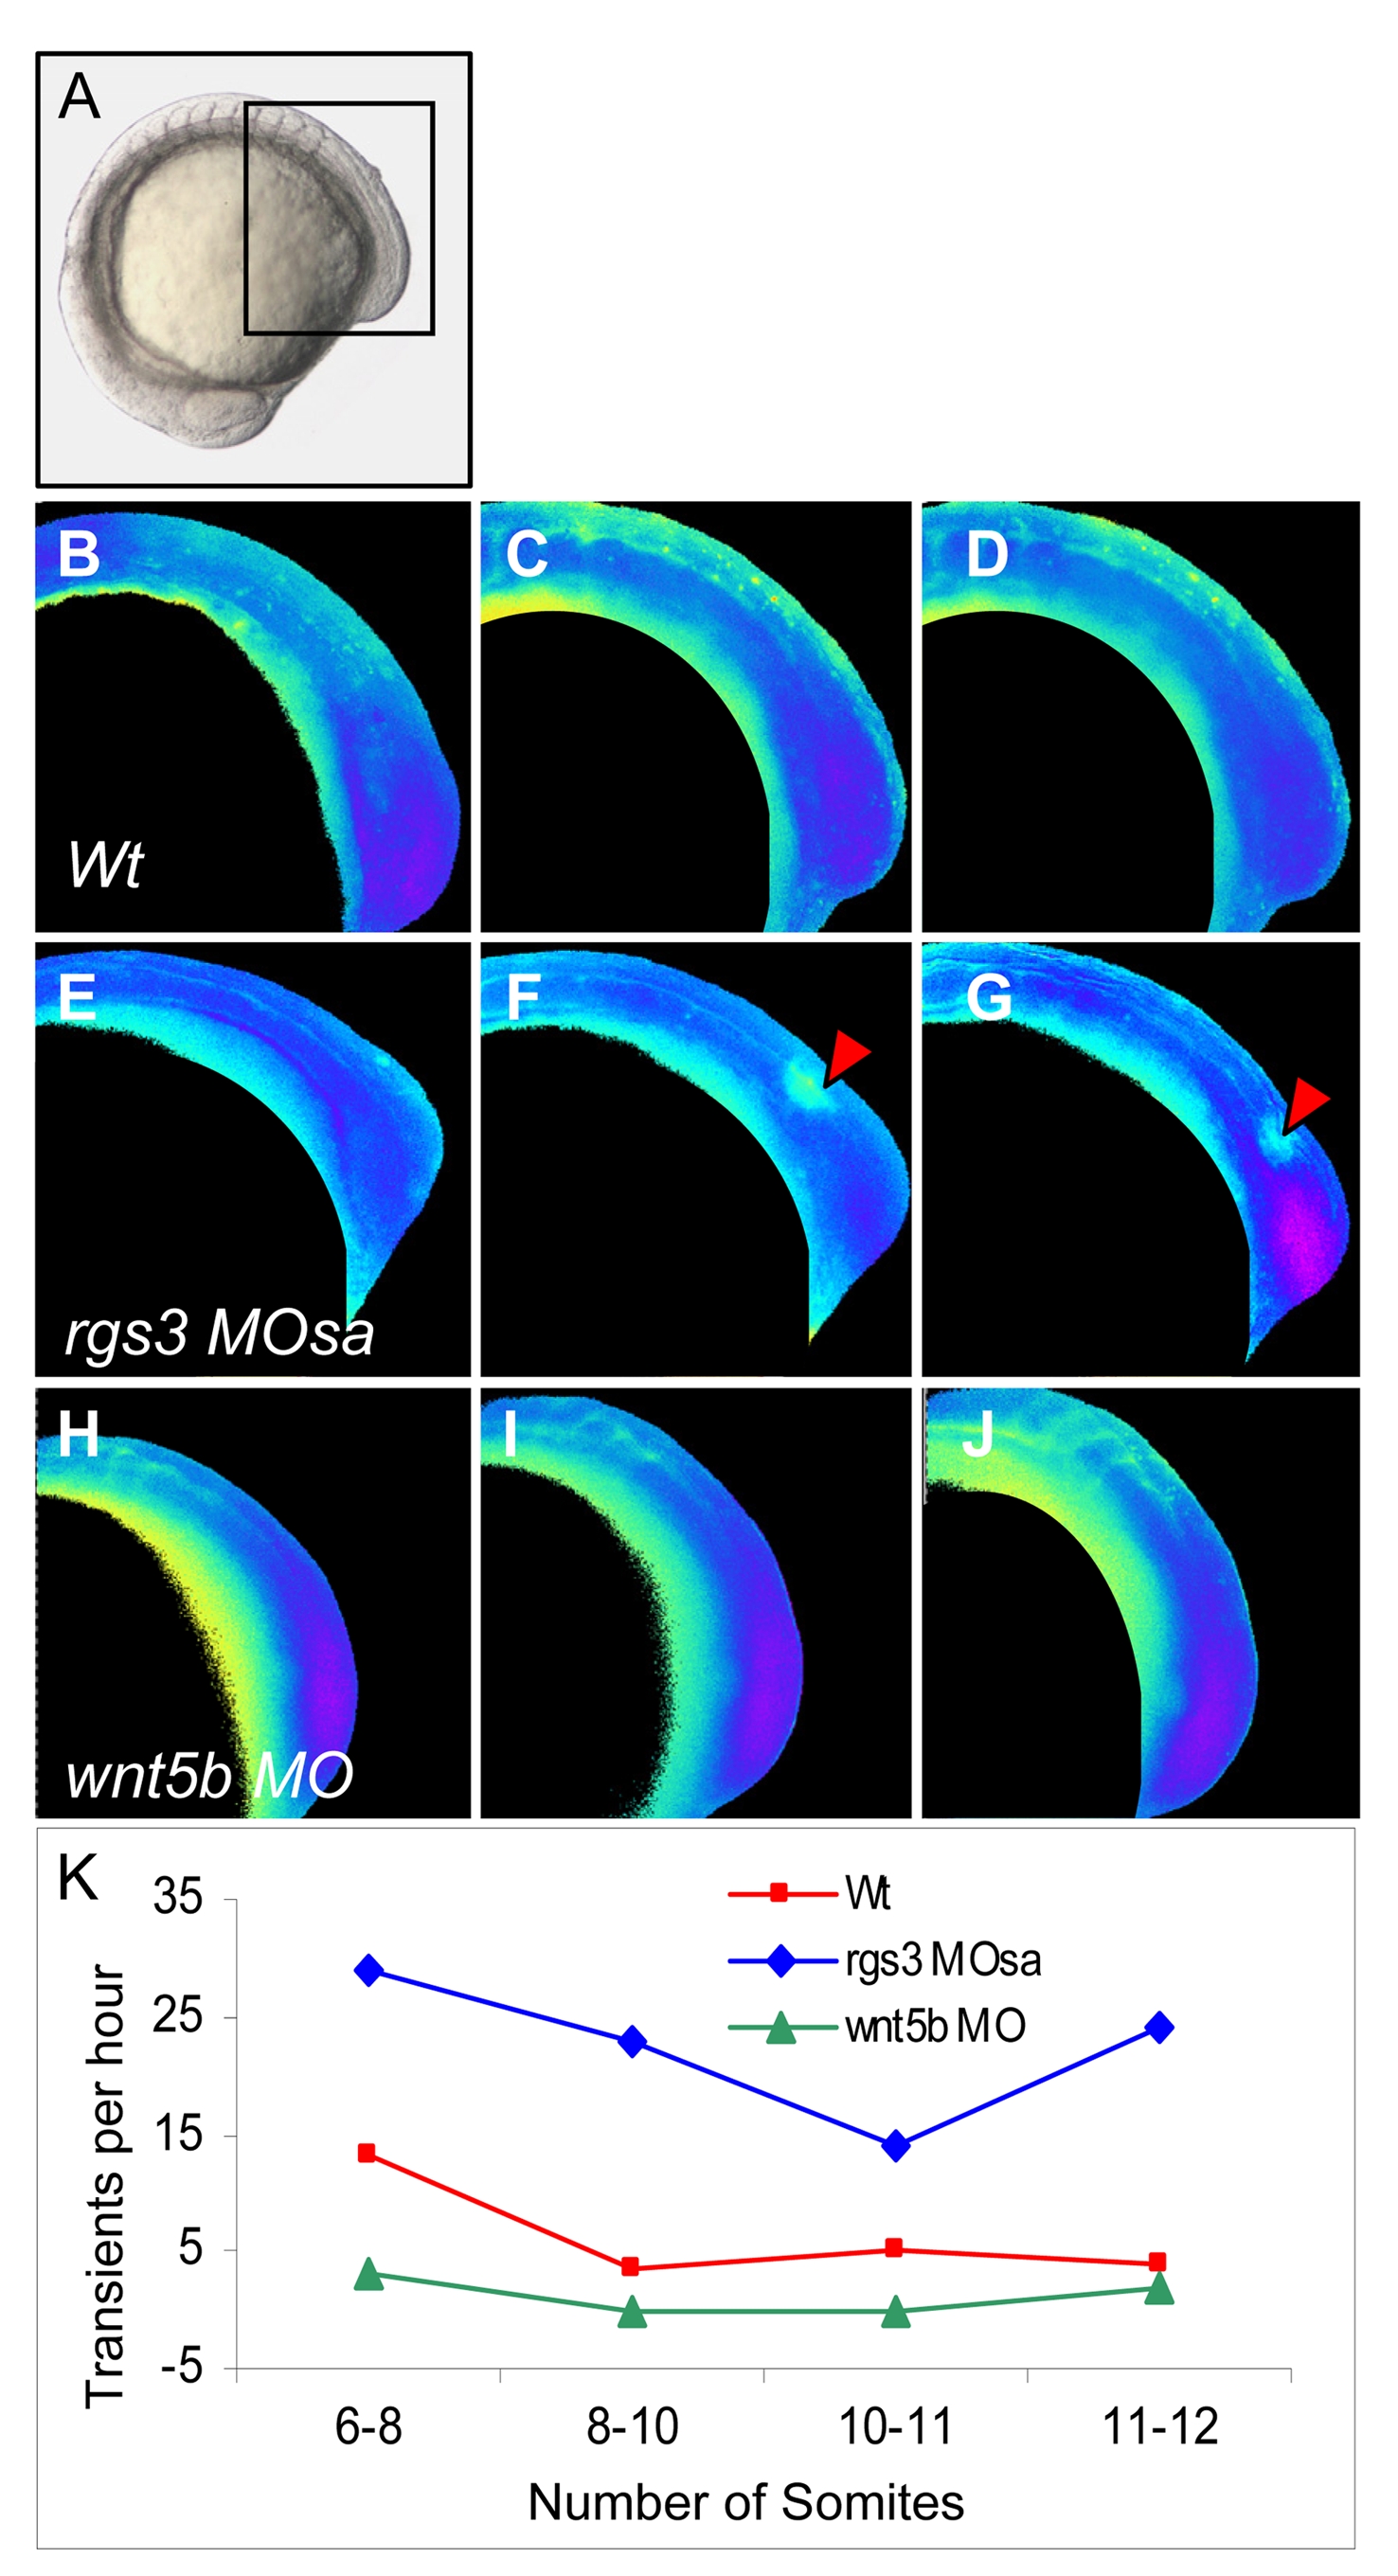
Fig. S2 rgs3 impacts segmentation stage calcium dynamics, related to Figure 5. Zebrafish embryos injected with Fura-2 oriented in a lateral posterior view (A) with a focus on the developing somites and tail (boxed region). Ratio images, pseudocolored to represent low Ca2+ as blue and high Ca2+ as yellow/red (B–J). Representative ratio images of 6 somite stage (B, E and H), 8 somite stage (C, F, and I) and 10 somite stage (D, G and J) embryos. Arrowheads indicate large Ca2+ transients in rgs3 morphant embryos (E–G) that are not observed in Wt (B–D) or wnt5b morphant embryos (H–J). The number of Ca2+ transients per hour observed in embryos oriented in a lateral posterior view from 6 to 12 somite stage is represented function of developmental age is represented graphically (K).