
- Title
-
IGF signaling between blastema and wound epidermis is required for fin regeneration
- Authors
- Chablais, F., and Jazwinska, A.
- Source
- Full text @ Development
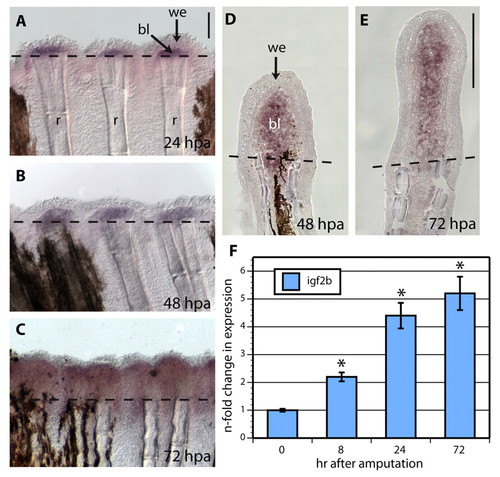
igf2b is expressed in the blastema of regenerating fins. (A-C) Whole-mount in situ hybridization with igf2b mRNA antisense probe (purple) reveals gene expression at the distal region underneath the wound epidermis at 24 (A), 48 (B) and 72 (C) hpa. Dashed lines indicate the amputation plane. The regenerated tissue is located above the dashed lines. (D,E) In situ hybridization performed on cryosections at 48 and 72 hpa demonstrates igf2b expression in the blastema. (F) Quantitative RT-PCR determination of igf2b mRNA in regenerating fins at 8, 24 and 72 hpa relative to control fins at 0 hpa, which as calibrator samples were normalized to 1.00. Error bars represent s.e.m. *P<0.001; n=3 samples, each was prepared from 10-15 fins. bl, blastema; r, ray with skeletal elements; we, wound epidermis. Scale bars: 100 μm in A,E. EXPRESSION / LABELING:
|
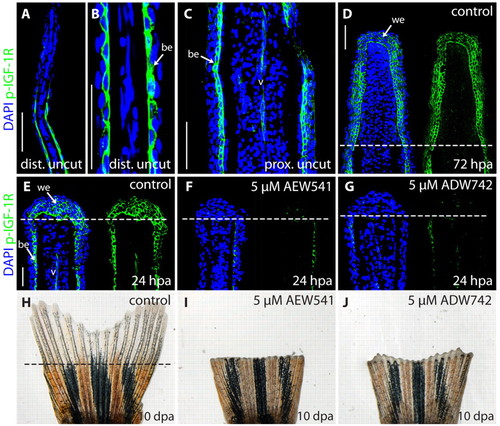
NVP-AEW541 and NVP-ADW742 block Igf1r signaling in zebrafish fins, resulting in inhibition of fin regeneration. (A-G) Longitudinal fin sections stained with phospho-Igf1r antibody (green) and DAPI (blue) to visualize nuclei. (A,B) A distal part of an uncut fin shown at different magnifications. A single cell layer of the basal epidermis labeled with phospho-Igf1r antibody. The distal tip of the fin is devoid of phospho-Igf1r staining. (C) A proximal part of an uncut fin. Phospho-Igf1r antibody marks the basal epidermis and blood vessel (v). (D) A regenerative outgrowth at 72 hpa. The wound epidermis contains phospho-Igf1r-positive cells. The dashed line indicates the amputation plane. (E) A control fin at 24 hpa with phospho-Igf1r-positive cells in the wound epidermis, the basal epidermal layer of the stump, and in the endothelial cells of the blood vessels. Treatment with 5 μM NVP-AEW541 (F) or 5 μM NVP-ADW742 (G) severely reduces phospho-Igf1r staining in the fins at 24 hpa. (H-J) Whole caudal fins at 10 dpa display blocked regeneration after treatment with 5 μM NVP-AEW541 (I) or 5 μM NVP-ADW742 (J), compared with control (H). be, basal epidermis; v, blood vessel; we, wound epidermis. Scale bars: 50 μm in A,C,D,E. |
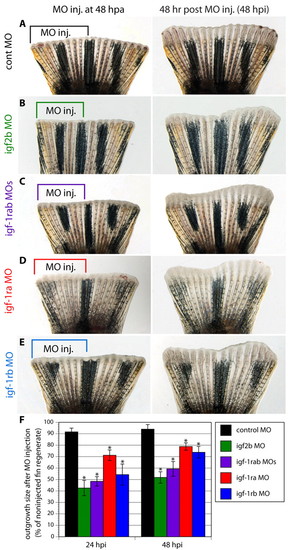
Morpholino-mediated igf2b and igf1rab knockdowns impair fin regeneration. (A-E) Fins microinjected into their dorsal half with control (A), igf2b (B), igf1ra + igf1rb (C), igf1ra (D) and igf1rb (E) MOs. The remaining non-injected half of the fin served as an internal control to assess the normal growth rate. The left panels show fins shortly after injection and the right panels show the same fins at 48 hpi. The control MO does not affect the size of the outgrowth relative to the uninjected side (A). The specific MOs impair regeneration, leading to an asymmetric shape of the regenerate (B-E). (F) Bar chart comparing the surface of regenerates that regrew within 24 and 48 hours after MO injection in relation to the uninjected fin regenerate. The injected:uninjected regenerate surface is significantly reduced by delivery of specific MOs. n=10 fins per group; *P<0.01. PHENOTYPE:
|
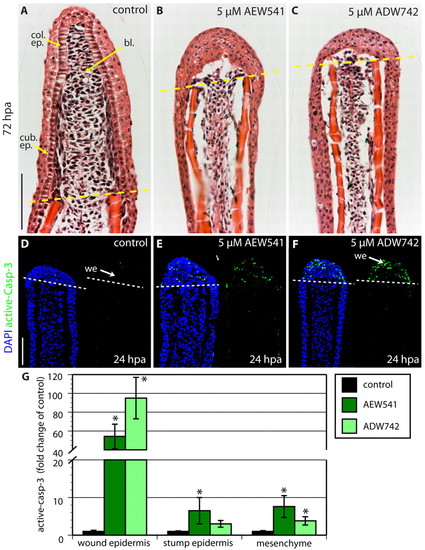
Igf1r signaling is required for the establishment of the wound epidermis. (A-C) Longitudinal sections of fins at 72 hpa stained with Hematoxylin and Eosin. The dashed line marks the amputation plane. In control fin regenerates, the basal epithelium consists of ordered linear cuboidal epithelial cells in the proximal part and columnar epithelial cells at the apical end. The blastema is also indicated by an arrow (A). Fins treated with either NVP-AEW541 (B) or NVP-ADW742 (C) lack a distinctive basal layer of the wound epidermis and the blastema. (D-F) Longitudinal sections of fins at 24 hpa stained with active-Caspase-3 antibody (green) and a nuclear marker DAPI (blue). Control fins display only individual active-Caspase-3-positive cells (D). Exposure to either NVP-AEW541 (E) or NVP-ADW742 (F) markedly enhances cell apoptosis specifically in the wound epidermis. (G) Quantification of active-Caspase-3 in control and inhibitor-treated fins at 24 hpa. n=6; *P<0.01. bl., blastema; col. ep., columnar epithelial cells; cub. ep., cuboidal epithelial cells; we, wound epidermis. Scale bars: 50 μm. PHENOTYPE:
|
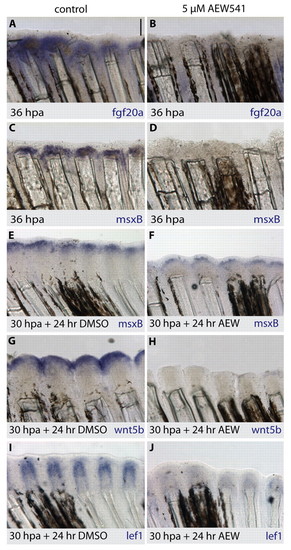
IGF signaling is required for the expression of blastemal and wound-epidermal marker genes. Whole-mount in situ hybridization of fins with antisense probes (purple). (A-D) In control fins at 36 hpa, fgf20a and msxB are strongly detected in the blastema of the outgrowth (A,C). In fins treated with NVP-AEW541, the expression of the blastemal marker genes is almost undetectable (B,D). (E-J). Drug-shift experiment (30 hours at normal conditions and 24 hours with treatment). Control fins express msxB in the blastema (E), wnt5b in the apical wound epidermis and distal tip of the blastema (G), and lef1 in the proximal wound epithelium and distal blastema (I). Exposure to NVP-AEW541 (F,H,J) strongly diminished expression of these genes. Scale bar: 100 μm. EXPRESSION / LABELING:
|
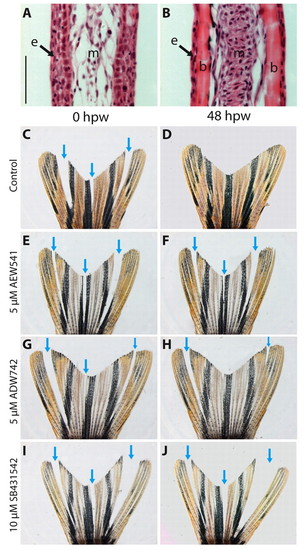
Interray wound-healing assay demonstrating the role of IGF and Activin/TGFβ signaling in wound closure. (A,B) Hematoxylin and Eosin staining of longitudinal fin sections. (A) Interrays lack skeletal elements, have multilayered epidermis, and very loose mesenchyme. (B) Rays contain bones covered by thin epidermis. Mesenchyme appears as a compact aggregation of interconnected fibroblasts. (C-J) Bright-field images of injured fins. Arrows indicate incisions between the bony rays. These interray notches were closed after 48 hours in control fins (C,D). Exposure to either NVP-AEW541 (E,F) or NVP-ADW742 (G,H) markedly impaired wound healing. Treatment with the inhibitor of Activin/TGFβ signaling, SB431542, completely blocked wound closure (I,J). b, bones; e, epidermis; m, mesenchyme; hpw, hours post-wounding. Scale bar: 50 μm. PHENOTYPE:
|
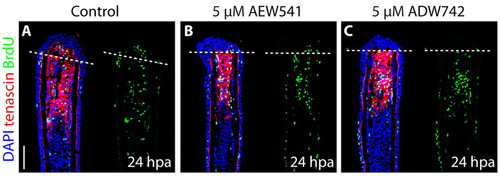
Inhibition of IGF signaling does not affect cell proliferation and Tenascin C expression at the onset of blastema formation. (A-C) Fin regenerates at 24 hpa triply stained with BrdU antibody (green), Tenascin C antibody (red) and DAPI (blue). The dashed line demarcates the amputation plane. At this stage of regeneration, no difference in cell proliferation or Tenascin C expression is detected between the control (A) and Igf1r inhibitor-treated fins (B,C). Scale bar: 50 μm. EXPRESSION / LABELING:
|
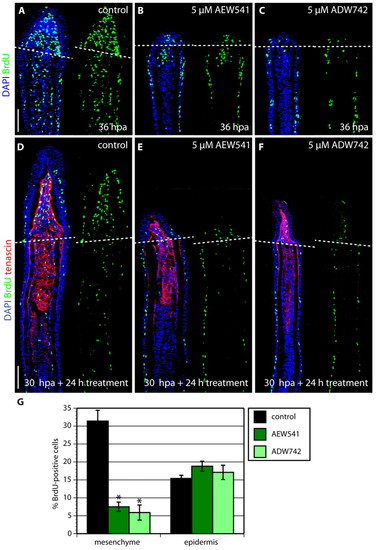
IGF signaling is required for proliferation of blastema cells. (A-C) Longitudinal sections of fins at 36 hpa stained with BrdU antibody (green) and DAPI (blue). Fins treated with either NVP-AEW541 (B) or NVP-ADW742 (C) display decreased mesenchymal proliferation and no blastemal outgrowth, compared with control (A). (D-F) Longitudinal sections of fins after a drug shift: 30 hours at normal conditions followed by 24 hour treatment with 0.05% DMSO (control) (D), 5 μM NVP-AEW541 (E) and 5 μM NVP-ADW742 (F), triply stained with BrdU antibody (green), Tenascin C antibody (red) and DAPI (blue). The dashed line demarcates the amputation plane. In control fins, the blastema displays massive proliferation (D). The smaller size of the outgrowth and reduction of blastemal proliferation demonstrates a block of normally initiated regeneration after the exposure to the drug. (G) The percentage of BrdU-positive cells relative to total number of cells in regenerating fins after DMSO (control) or inhibitor treatment for 24 hours starting at 30 hpa. The counted nuclei were located up to ∼350 μm from the distal tip of the fin sections. Error bars represent the s.e.m. n=6; *P<0.01. Scale bars: 50 μm. |
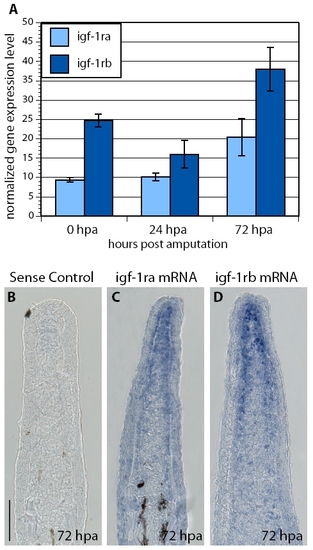
Two related igf-1 receptors are expressed in zebrafish fins. (A) Quantification of expression levels of igf-1ra and igf-1rb normalized to ubiquitously expressed β-actin reference gene in amputated fins at 0, 24 and 72 hpa (error bars indicate the s.e.m.; n=3 samples prepared from 10-15 fins). The normalized gene expression (NGE) values were calculated with the Pfaffl method and multiplied by a factor of 10,000. (B-D) In situ hybridization of fin sections at 72 hpa using control sense probe (B), antisense igf-1ra probe (C) and antisense igf-1rb probe (D). Both receptors appear to be ubiquitously expressed. Higher levels of expression are detected in the blastema. Scale bar: 50 μm. |
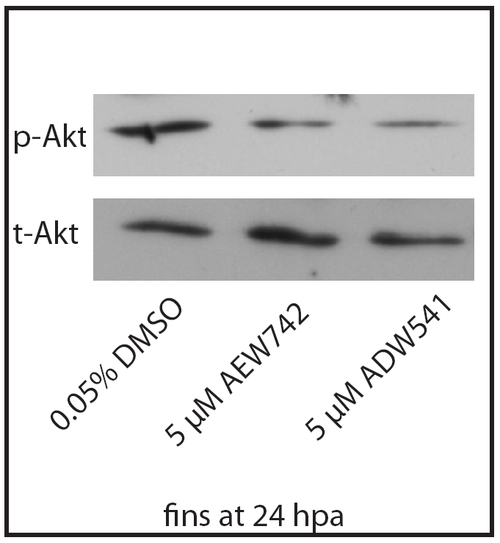
NVP-AEW541 and NVP-ADW742 block Akt phosphorylation in zebrafish fins. Western blots for phospho-Akt (p-Akt) and total-Akt (t-Akt) were prepared from regenerating fins at 24 hpa treated with 0.05% DMSO (control), 5 μM NVP-AEW54 or 5 μM NVP-ADW742. A marked decrease of p-Akt is observed after treatment with NVP-AEW541 and NVP-ADW742. t-Akt was used as a loading control. |
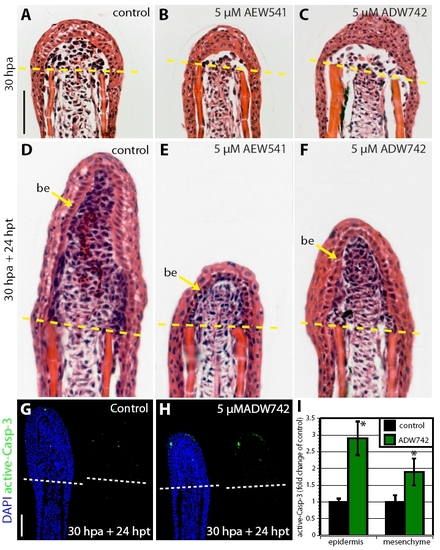
The effect of IGF-1R signaling on the wound epidermis. (A-F) Hematoxylin-Eosin stained fin sections. (A-C) At 30 hpa, the basal layer of the wound epidermis of the control fin (A) appears more ordered and aligned than in fin treated with NVP-AEW541 (B) or NVP-ADW742 (C). (D-F) Drug-shift experiment: 30 hours at normal conditions and 24 hours with treatment. The architecture of the wound epidermis appears similar in control (D) and inhibitor-treated (E,F) fins. (G,H) Drug-shift experiment (30 hours at normal conditions and 24 hours with treatment). Sections of regenerates stained with active-Caspase-3 antibody in green and a nuclear marker DAPI in blue. Control fins (G) and ADW742-treated fins (H) contain low amounts of active-Caspase-3-positive cells. (I) Quantification of active-Caspase-3 in control and inhibitor-treated fins in the drug-shift experiment. n=6; P<0.01. Scale bars: 50 μm. |
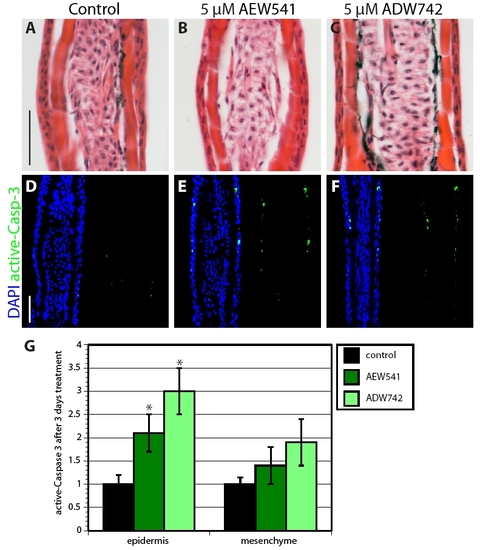
Inhibition of IGF signaling increases cell apoptosis in uninjured epidermis. (A-C) Hematoxylin-Eosin stained rays of uninjured fins that were treated with 0.05% DMSO (A), NVP-AEW541 (B) or NVP-ADW742 (C) do not display differences in morphology of the epidermis. (D-F) Sections of uninjured fins stained with active-Caspase-3 antibody in green and with the nuclear marker DAPI in blue. IGF-1R inhibitor-treated fins (E,F) contain a few more active-Caspase-3-positive cells in the epidermis than in the control (D). (G) Quantification of active-Caspase-3 in uninjured fins treated with IGF-1R inhibitors for 3 days. n=6; P<0.01. Scale bars: 50 μm. |
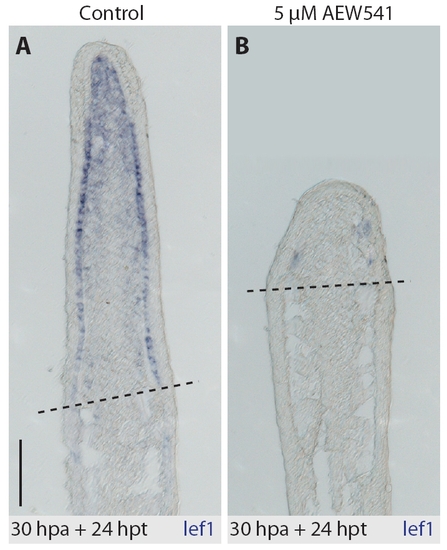
In situ hybridization of fin sections with lef1 antisense probe. Drug-shift experiment (30 hours at normal conditions and 24 hours with treatment). (A) In control regenerate, lef1 transcript is detected in the basal layer of the wound epidermis, except the apical part, and in the distal blastema. (B) lef1 transcript is downregulated in the NVP-AEW541-treated fins. |
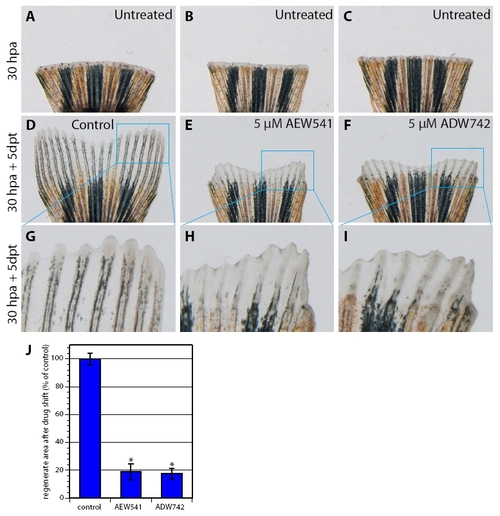
IGF signaling is required for the progression of normally initiated regeneration. (A-I) Bright-field images of fins in a drug-shift experiment: 30 hours at normal conditions and 5 days with treatment. (A-C) Fins before inhibitor treatment at 30 hpa. (D-F) Fins after additional 5 days exposure to 5 μM AEW541 (E) and 5 μM ADW742 (F) reveal impaired regeneration in comparison with control treated with 0.05% DMSO (D). (G-I) Higher magnifications of the fin regenerates reveal aberrant differentiation of the skeletal rays and weaker pigmentation after inhibitor treatment (H,I) in comparison with control (G). (J) Quantification of the outgrowth size after the drug-shift experiment. n=3; *, P<0.001. |