
- Title
-
Cadherin-2 controls directional chain migration of cerebellar granule neurons
- Authors
- Rieger, S., Senghaas, N., Walch, A., and Köster, R.W.
- Source
- Full text @ PLoS Biol.
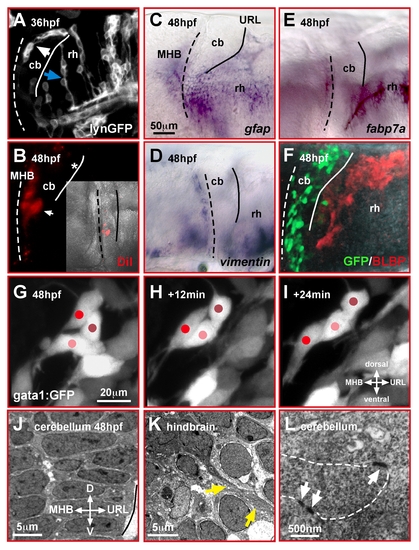
Migrating cerebellar GCs interact in a homophilic manner. (A–F) Lateral view of the zebrafish cerebellum and caudal hindbrain. Neither mosaic expression of membrane-targeted lynGFP (A) nor DiI-injection into the URL (B) reveals glia-like cell morphologies in the cerebellum, unlike that found in the hindbrain (blue arrow). In the cerebellum, GCs emigrating from the URL form chain-like structures (white arrow). Expression of the glia markers gfap (C), vimentin (D), fabp7a (E), and BLBP-immunohistochemistry in gata1:GFP embryos (F) supports that glia cells are absent in the cerebellum during GC migration. (G–I) In vivo time-lapse images (lateral view) of fluorescent GCs in gata1:GFP WT embryos reveals intense interactions among migrating GCs, which alternate in forward movements and resting behavior (see Video S1). (J–L) The differentiating cerebellum shows a highly ordered cellular arrangement when analyzed by TEM (J), with direct contacts of cerebellar cells via adherens junctions (L, white arrows). In the hindbrain (K), in contrast, fiber-like processes (yellow arrows) are present between individual cells (see also A, blue arrow). The MHB and URL are marked with a dashed and solid line, respectively. cb, cerebellum; MHB, midbrain-hindbrain boundary; rh, rhombencephalon. |
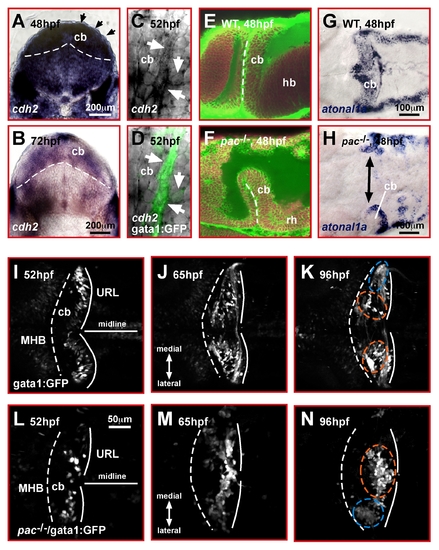
Cadherin-2 is a likely candidate to mediate GC migration in the zebrafish cerebellum. (A, B) Transverse view of the developing zebrafish cerebellum after ISH shows cadherin-2 expression during stages of prominent GC migration (black arrowheads point out dorsal most cerebellar region where migrating GCs are positioned). (C, D) Lateral view high magnification of the cerebellum. Migrating GCs in gata1:GFP transgenic embryos co-express cadherin-2 at high levels (white arrows). (E, F) Combined TOPRO and Bodipy-Ceramide staining of the cerebellum (lateral view) in WT (E) and pac-/- embryos (F). The rudimentary cerebellum in pac-/- embryos still forms a rhombic lip, as demarcated by expression of atoh1a (G: WT, H: pac-/- embryos, dorsal views, anterior is left). (I–N) Migration routes of GCs in the cerebellum. Dorsal view time-lapse sequence of migrating GCs in gata1:GFP transgenic embryos. (I–K) WT GCs migrate preferentially toward and along the MHB to form two clusters: the dorsomedial corpus cerebelli (orange dashed circles in K) and ventro-lateral eminentia granularis (blue dashed circle in K, see Video S2). (L–N) In pac-/- mutants, GCs of the dorsally forming corpus cerebelli remain close to the URL and settle in ectopic clusters (see Video S3). The MHB and URL are delineated with a dashed and solid line, respectively. Anterior is left. cb, cerebellum; hb, hindbrain; MHB, midbrain-hindbrain boundary; URL, upper rhombic lip. |
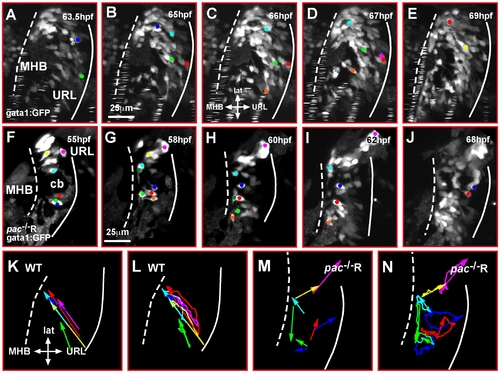
Cadherin-2 regulates coherence of cerebellar GC migration. (A–J) Maximum intensity projections of individual time-lapse stacks show GC migration in the right cerebellar lobe of gata1:GFP WT and gata1:GFP/pac-/-R-embryos. Cell tracings reveal that GCs in WT cerebella (A–E) migrate collectively toward the MHB, whereas individually migrating pac-/-R GCs (F–J) follow deviant paths (compare also Video S4 and Video S5). Plotting the migratory tracks from start to end point (K–N) shows a highly coherent and directional migration of WT GCs (K, L) in contrast to pac-/-R GCs (M, N) (e.g., compare dark blue and red tracks in L and N). cb, cerebellum; MHB, midbrain-hindbrain boundary; URL, upper rhombic lip. |
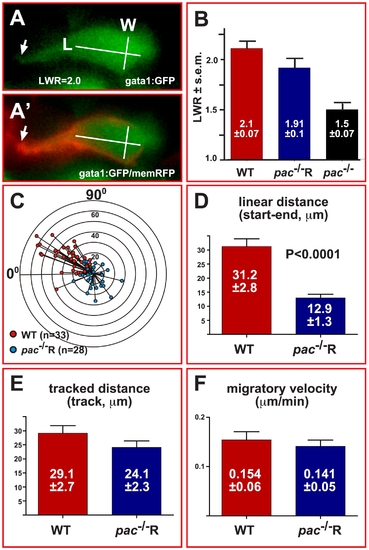
Cadherin-2 maintains directionality but not velocity of cerebellar GC migration. (A) Example of length-width measurements in individual gata1:GFP GCs, co-expressing membrane-bound RFP to visualize cell contours (A′, see also Video S6). (B) WT GCs (LWR 2.1±0.07, n = 50) and pac-/-R GCs (LWR 1.91±0.1, n = 41) clearly polarize, unlike GCs in pac-/--mutants (LWR 1.5±0.07, n = 51). (C) Graph showing the migrated distance of GCs plotted against their direction over a time course of 4 hours (0° marks MHB, 90° marks lateral edge of cb, concentric circles indicate migration distance in 10 μm steps). The orientation of GCs in gata1:GFP-embryos (Figure 8C) correlates well with their migratory direction (red dots, n = 33). Similarly, the random orientation of GCs in gata1:GFP/pac-/-R-embryos (Figure 8C) leads to random migration with no preferred direction (blue dots, n = 28). (D) The linear migration distance is dramatically reduced for pac-/-R GCs (12.9±1.3 μm), compared to WT GCs (31.2±2.8 μm), while traced distances (E, WT: 29.1±2.7 μm versus pac-/-R: 24.1±2.3 μm) and migratory velocities (F, WT: 0.154±0.06 μm/min versus pac-/-R: 0.141±0.05 μm/min) are nearly identical. Error bars indicate standard errors of the mean (SEM). |
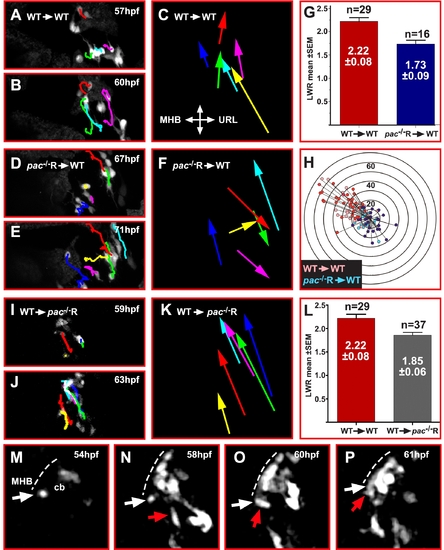
Cadherin-2 deficient GCs lack directional migration when transplanted into WT embryos. (A, B, D, E, I, J) Maximum intensity projections (dorsal view) of time-lapse recordings showing transplanted gata1:GFP/WT (A–C) and gata1:GFP/pac-/-R (D–F) donor GCs in the right cerebellar lobe of a WT host, whereas (I, J) shows transplanted gata1:GFP/WT GCs in a pac-/-R host cerebellum. Donor GCs derived from WT-WT transplantations are clearly polarized (G, red column, LWR: 2.22±0.08, n = 29) and migrate in a cohesive and directional manner, supported by cell tracing overlays (C) (see also Video S7, n = 4). In contrast, migration of pac-/-R donor GCs in a WT cerebellum is non-cohesive and non-directional, despite polarization of these cells (G, blue column, LWR: 1.73±0.09, n = 16) (see also Video S8, n = 4). (H) Distance and migration direction of WT and mutant donor GCs (gata1:GFP/WT-WT: pink, n = 33; gata1:GFP/pac-/-R: light blue, n = 18) in WT cerebella overlaid with tracings from respective non-transplanted GCs (see Figure 4C), i.e. gata1:GFP/WT (red) and gata1:GFP/pac-/-R GCs (dark blue) to show a similar migration pattern in both respective groups (WT + WT-WT and pac-/-R + pac-/-R-WT. (I–K) Transplanted gata1:GFP/WT GCs migrate in a pac-/-R host cerebellum in a cohesive and directional manner, supported by cell tracing overlays (see also Video S9, n = 3). (L) These Gata1:GFP/WT donors are polarized in a pac-/-R mutant environment as indicated by their LWRs (WT-WT 2.22±0.08; pac-/-R 1.85±0.06). (M–P) Transplantation of gata1:GFP/WT donor GCs into pac-/-R hosts revealing directional chain migration of WT GCs in a pac-/-R cerebellum. Note the group of GCs (red arrow in N, O, P) collectively migrating toward the MHB (dotted line) contacting an isolated quiescent GC, which subsequently joins the migrating GC chain (see also Video S9). All images are maximum intensity projections (dorsal view) of time-lapse recordings. Error bars indicate SEM. MHB: midbrain-hindbrain boundary. |
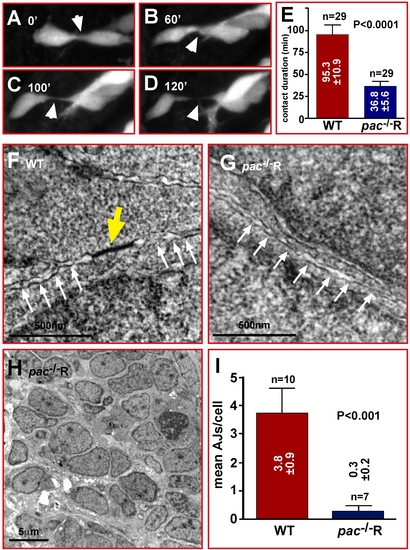
Migratory pac-/-R cerebellar GCs show reduced contact stability and adherens junctions. (A–D) Comparison of contact duration between individual gata1:GFP GCs in time-lapse sequences (white arrowheads) reveals that lack of Cadherin-2 in pac-/-R GCs significantly reduces the duration of stable cell-cell contacts (E, WT: 95.3±10.9 min versus pac-/-R: 36.8±5.6 min, n = 29). (F–H) TEM analysis reveals that AJs between pac-/-R cerebellar neurons are largely absent (G), while numerous AJs are found between individual WT cerebellar neurons (F). (H) pac-/-R cerebellar neurons appear disorganized (compare with Figure 1J). (I) Quantification of TEM images (3.8±0.9 AJs, n = 10, in WT versus 0.3±0.2 AJs, n = 7, in pac-/-R-cerebella). |
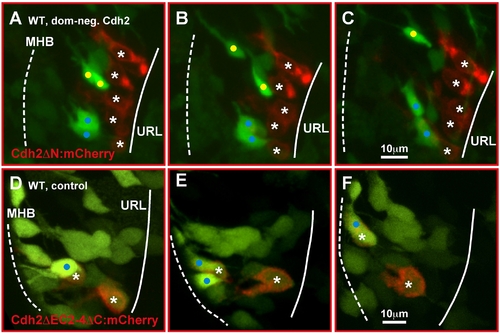
Inhibition of Cadherin-2 function impairs emigration of URL progenitor cells. (A–C) Maximum intensity projections of time-lapse movie (dorsal view) showing GFP-negative granule progenitors in the URL (solid line) of gata1:GFP embryos expressing a dominant-negative Cadherin-2 variant under the control of a heatshock-inducible promoter element at 55 hpf (8xHSECdh2ΔN-mCherry). Fluorescently labeled progenitors fail to delaminate from the URL and do not join GC chains migrating toward the MHB (dotted) (see Video S10). (D–F) Expression of Cdh2ΔEC2–4ΔC-mCherry, a non-functional Cdh2-reporter, does not interfere with GC migration. These GCs co-activate GFP during initiation of migration toward the MHB (see Video S11) [25]. MHB, midbrain-hindbrain boundary; URL, upper rhombic lip. |
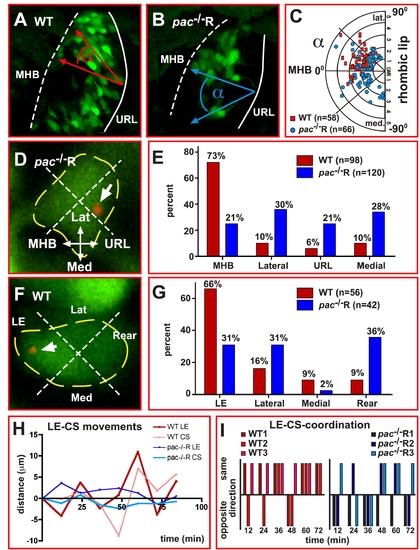
Centrosome positioning is uncoupled from migratory directionality in Cadherin-2 deficient GCs. (A, B) Example for quantification of GC polarization using dorsal view confocal projections of right cerebellar lobes in WT (A) and pac-/-R (B) gata1:GFP embryos. For quantification, the polarization of GFP-expressing GCs (LWR see Figure 4B) as well as the orientation of the long axis of a GC with respect to the MHB was determined. (C) The angle between the long axis of a GC and the linear axis between MHB and URL is plotted as function of their respective LWRs. Whereas WT GCs preferentially polarize in anterior-lateral directions toward the MHB (red squares, n = 58), pac-/-R GCs display no preference in polarization, being randomly oriented in the cerebellum (blue dots, n = 66). (D, F) Method for quantification of centrosome position in GCs co-expressing the centrosome-localized centrin-td-Tomato fluorescent protein (white arrows mark centrosome, yellow dashed lines mark soma). (E) While the centrosome in more than 70% of analyzed WT GCs (red bars, n = 98) is localized toward the MHB, the centrosome in pac-/-R GCs shows no preferred orientation (blue bars, n = 120). (F) Quantification of centrosome position with respect to cell morphology. (G) In WT GCs, the centrosome preferentially locates to the leading edge, while no preferred location is found in pac-/-R GCs. (H, I) The relationship between centrosome and leading edge dynamics was quantified by simultaneously tracing these structures within the same GC (n = 3, each group), using the ImageJ manual tracking tool. (H) In WT GCs, the centrosome movements follow leading edge movements thus moving in the same direction (I, n = 13/17, see Video S12), whereas in pac-/-R GCs centrosome movements independent of the leading edge are apparent often occurring in opposite directions (I, n = 7/18 movements in same direction, see Video S13). Lat, lateral; LE, leading edge; Med, medial; MHB, midbrain-hindbrain boundary; URL, upper rhombic lip. |
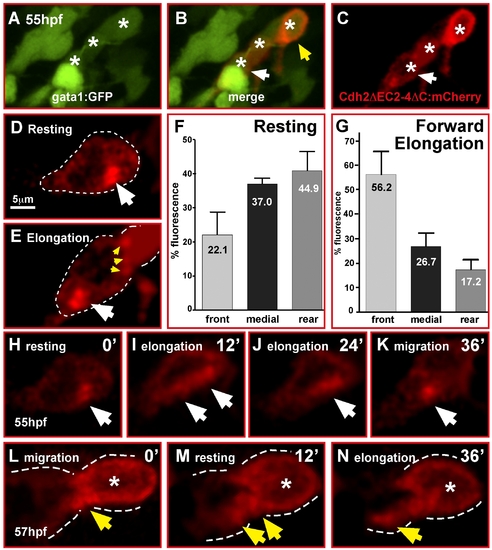
Cadherin-2 relocalization is coordinated with GC migration. (A–E, H–N) Single optical sections of time-lapse recordings using laser-scanning confocal microscopy. (A–C) Heat shock-induced expression of Cadherin-2 reporter protein (Cdh2ΔC2-4ΔC:mCherry) in a cerebellar GC chain (white asterisks). White arrows in (B, C) mark the neuron shown in (H–K), see also Video S14. (D, E) Cdh2ΔC2-4ΔC:mCherry fluorescence is localized in clusters in contact with neighboring GCs (E, yellow arrowheads), but cluster localization changes during migration mostly differing during resting (D) and forward elongation (E) of GCs prior to migration. (F) Quantification of mCherry-fluorescence shows that in resting GCs Cadherin-2 clusters are more evenly distributed, but preferentially localized in the medial and rear compartment of the cell (n = 5, p = 0.056, error bars indicate SEM). (G) Forward migration, in contrast, leads to Cadherin-2 redistribution towards the front compartment of GCs (n = 5, p<0.01). (H–K) Individual images of a time-lapse movie demonstrating the relocation of the Cdh2ΔC2-4ΔC:mCherry reporter (white arrow) after a resting phase from the rear of the cell (H) along the cytoplasmic membrane (I, J) during elongation of the GC to the front (K) to prepare for the next forward movement. (L–N) Localization of Cdh2ΔEC2-4ΔC-mCherry reporter in GCs contacting each other in a migratory GC chain (B, yellow arrowhead). (L) Fluorescence is condensed at contact sites of GCs but partly being redistributed according to migratory movements (M, N). |
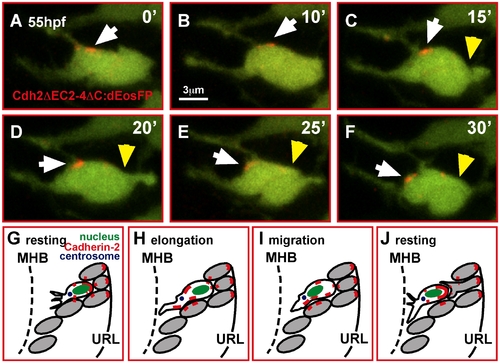
In migrating GCs Cadherin-2 is relocalized along the membrane. (A–F) Time-lapse sequence of Cdh2ΔEC2-4ΔC:dEosFP clusters, UV-converted at the membrane of a migrating GC in a gata1:GFP embryo (white arrowheads). A photo-converted cluster (red) moves successively toward the leading edge during GC elongation and migration (yellow arrowheads mark the trailing edge of the cell, see also Video S15). (G–J) Model of Cdh2-regulated granule cell migration (see text). MHB, midbrain-hindbrain boundary; URL, upper rhombic lip. |
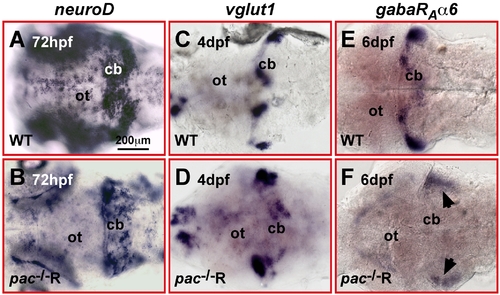
Impaired terminal differentiation of migrating Cadherin-2 deficient GCs. (A–F) Dorsal views of WT (A, C, E) and pac-/-R cerebella (B, D, F). ISH for the granule cell differentiation markers neuroD (A, B, 3dpf), vglut1 (C, D, 4dpf), and gabαRa6 (E, F, 6dpf). NeuroD expression in pac-/-R cerebella appears scattered, likely resulting from randomly migrating GCs. However, the strength of expression is similar to WT. Vglut1 expression is strongly reduced in pac-/-R and expression of the terminal granule cell differentiation marker gabaRAα6 is almost absent in pac-/-R cerebella (black arrows depict residual patches of expression in ventro-lateral cerebellar regions). cb, cerebellum; ot, optic tectum. |
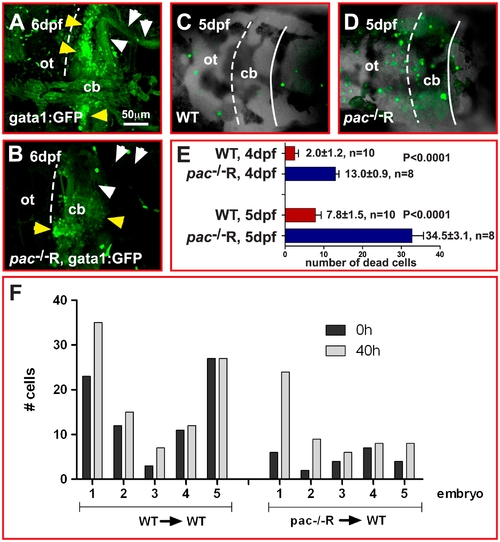
Increased cell death in pac-/-R cerebella at 5 dpf. (A–D) Dorsal views of confocal image stacks showing projected gata1:GFP WT (A) and pac-/-R (B) cerebella. Comparison indicates that the number of GFP-expressing GCs (yellow arrowheads) is severely reduced in pac-/-R and parallel fiber projections (white arrowheads) are lacking, consistent with a strong increase in cell death as visualized by acridine orange staining (compare WT: C to pac-/-R: D). (E) Quantification reveals that cell death in pac-/-R increases 3-fold between 4 and 5 dpf (after GC migration has ceased). For analysis, the student t-test was used, ***p<0.0001. Error bars indicate SEM. (F) Quantification of WT and pac-/-R donor cells in WT hosts (n = 5 embryos in each group, numbered 1–5 in graph) at 0 h (∼48–51 hpf) and termination of migration (40 h later) does not show decreased GC numbers, indicating that cell death occurs after migration during terminal GC differentiation. cb, cerebellum; ot, optic tectum. |
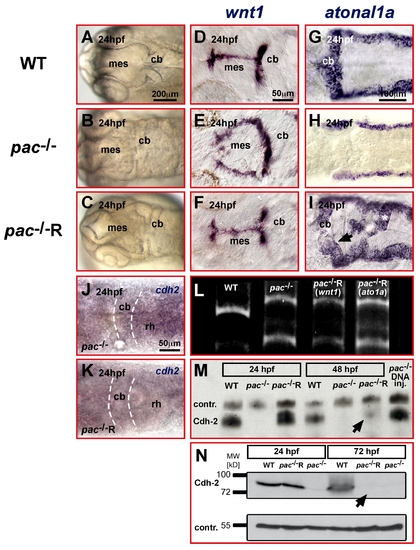
Temporal rescue of pac-/- embryos is restricted to developmental stages prior to cerebellar GC migration. (A–I) Dorsal views of zebrafish embryonic heads at 24 hpf. (A–C) Light microscopy of cerebellar primordium in WT (A) and pac-/- (B) embryos that can be rescued by Cdh2-mRNA injection in pac-/-R-embryos (C). (D–I) This rescue is confirmed by ISH showing the reconstitution of wnt1 dorsal midline expression (D–F) and atonal1a expression throughout the rhombic lip (G–I) in pac-/-R embryos. (L) RT-PCR confirms pac-/- genotype in rescued mutant embryos (tail clip RT-PCR lanes 3+4 was performed on same embryos displayed in F and I, respectively). (J, K) Whole-mount ISH analysis of cadherin-2 expression reveals that cadherin-2 mRNA is hardly detectable in both pac-/- (J) and pac-/-R-embryos (K) at 24 hpf (dorsal views of hindbrain). (M, N) In contrast, Western blot analysis of total embryo extracts including the membrane fractions detects Cadherin-2 protein in pac-/-R-embryos at 24 hpf, with levels comparable to WT embryos (lane 1). By 48 hpf, at the onset of GC migration, Cadherin-2 protein is mostly degraded in pac-/-R-embryos (M, lane 6, black arrow) and completely absent at 72 hpf (N, lane 6). While Cdh2 protein derived from mRNA injections is mostly degraded at 48 hpf, Cdh-2 protein is continuously expressed from plasmid DNA (M, lane 7). Loading controls: TenascinR in (M) and β-Tubulin in (N). cb, cerebellum; mes, mesencephalon; rh, rhombencephalon. |
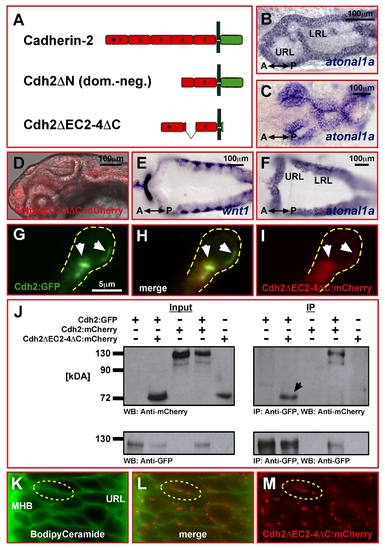
Cloning and verification of a Cadherin-2 variant as in vivo adhesion reporter protein. (A) Schematic representation of different Cadherin-2 variants (black diamond in EC1 represents cis-dimerizing activity). (B, C) Full-length Cadherin-2 (B) and dominant-negative Cdh2ΔN (C) mRNA-injected embryos analyzed by ISH for atoh1a expression at 24 hpf show severe morphological defects in the hindbrain (dorsal view, anterior is left). (D–F) In contrast, embryos injected with Cdh2ΔEC2-4ΔC:mCherry (D, lateral view of head, overlay with mCherry expression) do not reveal defects, neither by morphology nor by expression of wnt1 (E) or atoh1a (F). Furthermore, mRNA-injection of this variant was unable to rescue pac-/-R embryos (unpublished data). (G–I) Single optical section (1 μm) of a cell in the URL at 65 hpf, co-electroporated with full-length Cdh2:GFP and Cdh2ΔEC2-4ΔC:mCherry plasmid DNA. (G) Full-length Cadherin-2 preferentially clusters in the anterior cell and along the lateral plasma membrane (white arrowheads). The Cdh2ΔEC2-4ΔC:mCherry reporter variant (I) colocalizes with full-length Cadherin-2:GFP in the same regions (see GFP and mCherry overlayed in H). (J) Co-immunoprecipitation (IP) using the Cadherin-2:GFP fusion protein as bait (Input: lane 2) reveals direct interaction between Cdh2ΔEC2-4ΔC:mCherry and Cadherin-2:GFP (IP: lane 2). Full-length Cadherin-2:mCherry used as positive control shows similar interactions (IP: lane 4). (K–L) Bodipy Ceramide membrane staining (K) overlayed with Cdh2ΔEC2-4ΔC:mCherry fluorescence (L) expressed from injected mRNA shows membrane localization of this variant (L, M) and intact cellular morphologies in the cerebellum at 48 hpf. LRL, lower rhombic lip; MHB, mid-hindbrain boundary; URL, upper rhombic lip. |