
- Title
-
Establishment of a transitory dorsal-biased window of localized Ca(2+) signaling in the superficial epithelium following the mid-blastula transition in zebrafish embryos
- Authors
- Ma, L.H., Webb, S.E., Chan, C.M., Zhang, J., and Miller, A.L.
- Source
- Full text @ Dev. Biol.
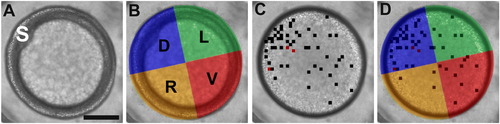
The quadrant analysis protocol. (A) A representative bright-field image of an embryo in an animal pole orientation at ∼ 6 hpf; the embryonic shield is labeled with an “S”. (B) Using the position of the shield to identify the dorsal region, the embryo was then divided into the dorsal (D), ventral (V), left (L) and right (R) quadrants. (C) The Ca2+ transients detected by the automated analysis algorithm from 2.25 hpf to 6 hpf were then superimposed onto the corresponding bright-field image (i.e., ∼ 3 hpf in this example). The black and red squares indicate where one or two Ca2+ transients were generated, respectively. (D) Assignment of these transients to the appropriate quadrant by retrospective application of the positional information obtained at 6 hpf. This analysis protocol was only applied to data acquired from embryos that were held stationary throughout the imaging period. Scale bar = 200 μm. |
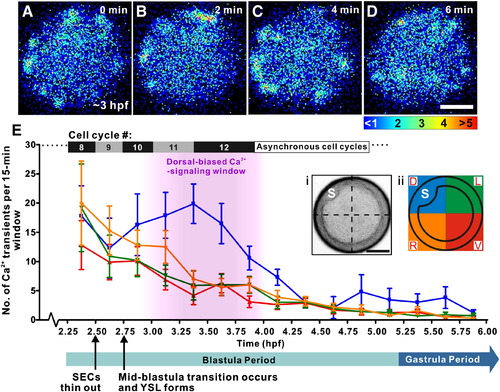
Analysis of the spatial distribution of the Ca2+ transients visualized in zebrafish embryos during the Blastula Period and early Gastrula Period. (A–D) An example of the transients observed at ∼ 3 hpf in a representative embryo. Each pseudocolor panel represents 50 s of accumulated luminescence with a 70-second gap between each image. The color scale represents aequorin-generated luminescence in photons/pixel. (E) Line graph to show the distribution of the number of Ca2+ transients observed in fifteen 15-minute time windows in the dorsal (blue), ventral (red), left (green) and right (orange) quadrants of the blastoderm from 2.25–6 hpf (i.e., from the 128-cell stage to the shield stage). Data are expressed as means and SEMs from n = 10 intact embryos. The dorsal-biased Ca2+ signaling window, which runs from ∼ 3.0 to 4.0 hpf, is highlighted in pink. Information regarding the approximate duration of cell cycles 8–12 (Kane et al., 1992) and the duration of the Blastula and early Gastrula Periods (Kimmel et al., 1995) are also shown. (Ei) Bright-field image and (Eii) schematic diagram of a representative embryo, showing the embryonic shield (“S”) and quadrant division information such that D, V, L and R are dorsal, ventral, left and right, respectively. Scale bars = 200 μm. |
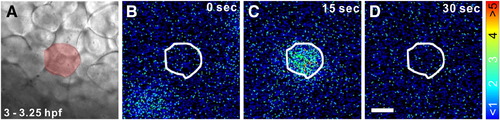
Representative example of a Ca2+ transient that was generated during the dorsal-biased Ca2+ signaling window in a single SEC between 3.0–3.25 hpf. (A) A bright-field image showing a region of the superficial epithelium. The SEC that generated the Ca2+ transient is highlighted in red. Panels B to D show the representative pattern of aequorin-generated luminescence, in pseudocolor, illustrating the localized Ca2+ transient. The border of the SEC generating the transient is highlighted in white. Each panel represents 30 s of accumulated luminescence, and consecutive panels are stepped at 15 s intervals. The color scale indicates aequorin-generated luminescence in photons/pixel. Scale bar = 50 μm. |
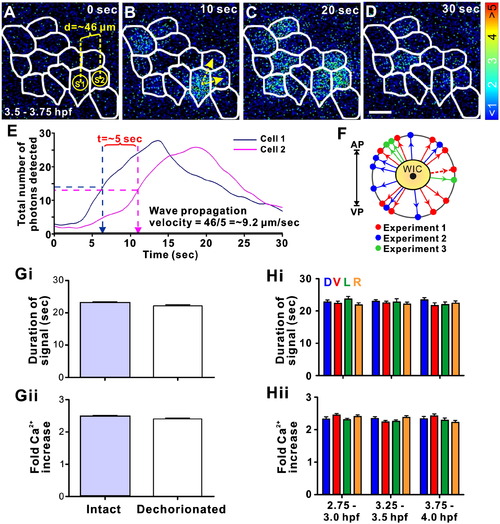
Representative example of a localized intercellular Ca2+ wave, which propagates between adjoining SECs generated between 3.5–3.75 hpf. Panels A to D show the representative pattern of aequorin-generated luminescence in pseudocolor, illustrating the propagating intercellular Ca2+ wave. The borders of the SECs are highlighted in white. Each panel represents 10 s of accumulated luminescence with no time interval between consecutive panels. To calculate the velocity of wave propagation, sampling regions S1 and S2 were placed on the wave initiation cell (WIC) and one of the neighboring cells through which the wave propagates, respectively (as shown in panel A). The distance between the center of S1 and S2 is ∼ 46 μm. The direction of wave propagation is shown in panel B (yellow arrows). Scale bar = 50 μm. Panel E shows the profile of the number of photons detected in S1 and S2 plotted against time (1 s of accumulated luminescence with no time interval between steps). The time taken for the wave fronts to pass from S1 to S2 was determined from this graph, by subtracting the half-height time of the peak from the first sampling region, from that of the second. Thus, the propagation velocity (distance/time) of the Ca2+ wave in this example is ∼ 9.2 μm/s. Panel F shows the direction of propagation from the center of the WIC (with respect to the animal–vegetal axis), of 19 waves from 3 representative experiments — represented by red, blue and green arrows, respectively. The direction of propagation of the representative wave shown in panels A–D is illustrated by a dashed red arrow. (G) Comparison of the (Gi) duration and (Gii) fold Ca2+ increase of the SEC Ca2+ transients, which occur during the dorsal-biased Ca2+ signaling window, in intact and dechorionated embryos. Data are expressed as means and SEMs of a total of ∼ 200 Ca2+ transients, from both 5 intact and 5 dechorionated embryos. (H) Comparison of the (Hi) duration and (Hii) fold Ca2+ increase of the Ca2+ transients recorded in the dorsal (D; blue), ventral (V; red), left (L; green) and right (R; orange) quadrants, just before the dorsal-biased Ca2+ signaling window (DCW; i.e., from 2.75–3.0 hpf), and during the early (i.e., from 3.25–3.5 hpf) and late (i.e., 3.75–4.0 hpf) DCW. Data are expressed as means and SEMs of 30–50 Ca2+ transients per quadrant at each time point, from 5 independent experiments. |
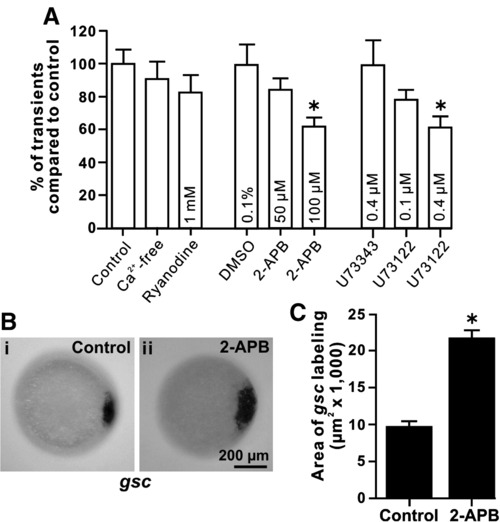
The effect of Ca2+-free conditions, or treatment with ryanodine, 2-APB, U73343 or U73122, on the SEC Ca2+ transients generated during the dorsal-biased Ca2+ signaling window and the effect of 2-APB on gsc expression. (A) Embryos exposed to 100 μM 2-APB or 0.4 μM U73122, but not other conditions, showed a significant decrease (at p < 0.01, as indicated by “*”) in the number of DCW Ca2+ transients, when compared with the corresponding control. Data are expressed as means and SEMs of 5 experiments for each treatment. (B) Expression pattern of gsc in representative (Bi) untreated (control) and (Bii) 2-APB-treated embryos at shield stage. Embryos were treated with 50 μM 2-APB from the 512-cell stage to the high stage. (C) Bar graph to show the area of gsc labeling. The mean ± SEMs of n = 4 (control) and n = 7 (2-APB treated) embryos are shown. The area of gsc expression was significantly increased (at p < 0.05, indicated by “*”) in the 2-APB-treated embryos. |
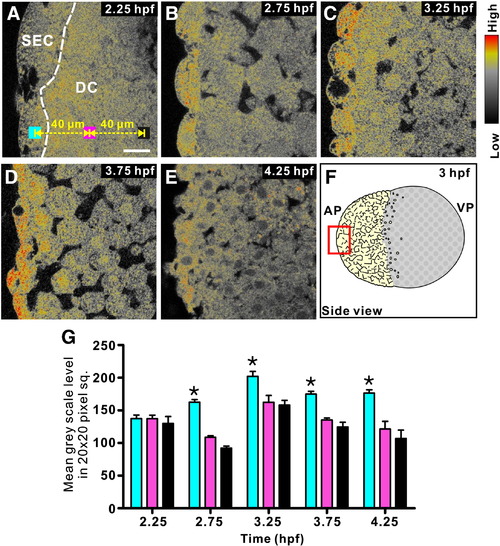
The distribution of IP3Rs in the zebrafish blastoderm from 2.25 hpf to 4.25 hpf. (A–E) Single confocal images taken though the blastoderm of embryos, which were fixed at the stage indicated in the upper right corner and then labeled by immunohistochemistry with the 18A10 monoclonal antibody. The color scale represents the relative level of IP3R labeling with red being the highest and black, the lowest level. In panel A, the white dashed line illustrates the boundary between the superficial epithelium and the underlying deep cells (DC) and the blue, pink and black squares represent the location of three 20 x 20-pixel sampling regions that were used to quantify the intensity of fluorescence in the SECs and in the deep cells at depths of 40 μm and 80 μm from the superficial epithelium. Panel F is a schematic to show the location on the blastoderm (in the red square) of the confocal images (panels A–E) acquired. (G) Histogram showing the relative level of fluorescence that was detected in the three 20 x 20-pixel size sampling regions (illustrated in panel A), at each time point. From 2.75–4.25 hpf, the fluorescent signals detected in the SECs were significantly higher (at p < 0.01, as indicated by “*”) than those detected in the deep cells. Scale bar = 20 μm. |
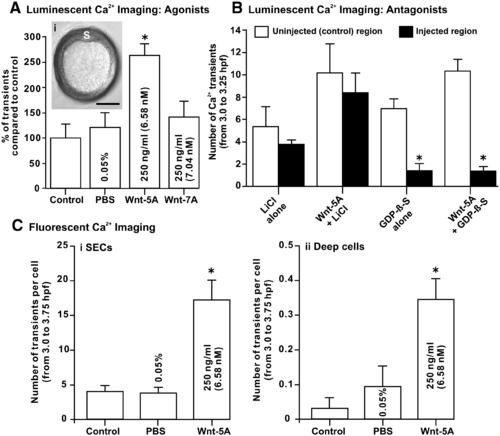
The effect of agonists and antagonists of the Wnt/Ca2+ signaling pathway on the SEC Ca2+ transients generated during the dorsal-biased Ca2+ signaling window. Ca2+ transient data collected via luminescent f-aequorin (A and B) and fluorescent calcium green-1 dextran (C and D) imaging. (A) Comparison of the number of DCW SEC-generated Ca2+ transients in untreated control embryos (as well as those treated with the PBS solvent) and in embryos treated with the Wnt/Ca2+ and Wnt/β-catenin signaling pathway ligands Wnt-5A and Wnt-7A, respectively. The insert (Ai) indicates that in Wnt-5A-treated embryos, where we recorded an approximate doubling in the number of Ca2+ transients, a normal shield (S) was still seen to form at ∼ 50% epiboly. Scale bar is 200 μm. (B) Embryos treated with the G-protein complex antagonist, GDP-β-S, display a significant decrease in both endogenous Ca2+ transients and in Wnt-5A-stimulated Ca2+ transients. Embryos were co-injected with GDP-β-S and rhodamine B dextran. Thus, the number of Ca2+ transients generated in fluorescent (GDP-β-S-treated) and non-fluorescent (untreated) regions of the superficial epithelium of the same embryo could then be compared. GDP-β-S was supplied as a trilithium salt, and therefore both untreated and Wnt-5A-treated embryos were also injected with a LiCl control buffer. (C) Fluorescent confocal imaging was also carried out to determine the precise cellular location of the Wnt-5A up-regulation of the Ca2+ transients. Thus, comparisons were made between the number of Ca2+ transients generated per cell in the (Ci) SECs and (Cii) deep cells, in both untreated embryos and in those treated with Wnt-5A (or its solvent control, PBS). In panels A–C, data are expressed as mean ± SEM of 4 independent experiments for each treatment, and “*” indicates results that are significantly different than the controls (at p < 0.05). |
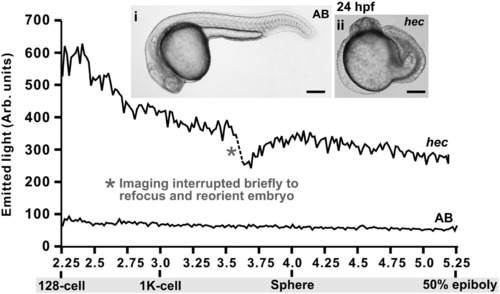
Representative changes in [Ca2+]i that occur in AB wild-type and hec mutant embryos during the Blastula Period (i.e., from the 128-cell stage to 50% epiboly). f-aequorin-generated data were plotted every 60 s, each data point representing 60 s of accumulated luminescence for an imaging field covering the entire blastoderm of each embryo (approximately 50,000 pixels). The traces are representative of n = 10 AB and n = 7 hec mutant embryos. The bright-field images (panels i and ii) show the morphology of the AB and hec embryos at 24 hpf. Scale bars are 200 μm. |
Reprinted from Developmental Biology, 327(1), Ma, L.H., Webb, S.E., Chan, C.M., Zhang, J., and Miller, A.L., Establishment of a transitory dorsal-biased window of localized Ca(2+) signaling in the superficial epithelium following the mid-blastula transition in zebrafish embryos, 143-157, Copyright (2009) with permission from Elsevier. Full text @ Dev. Biol.