
|
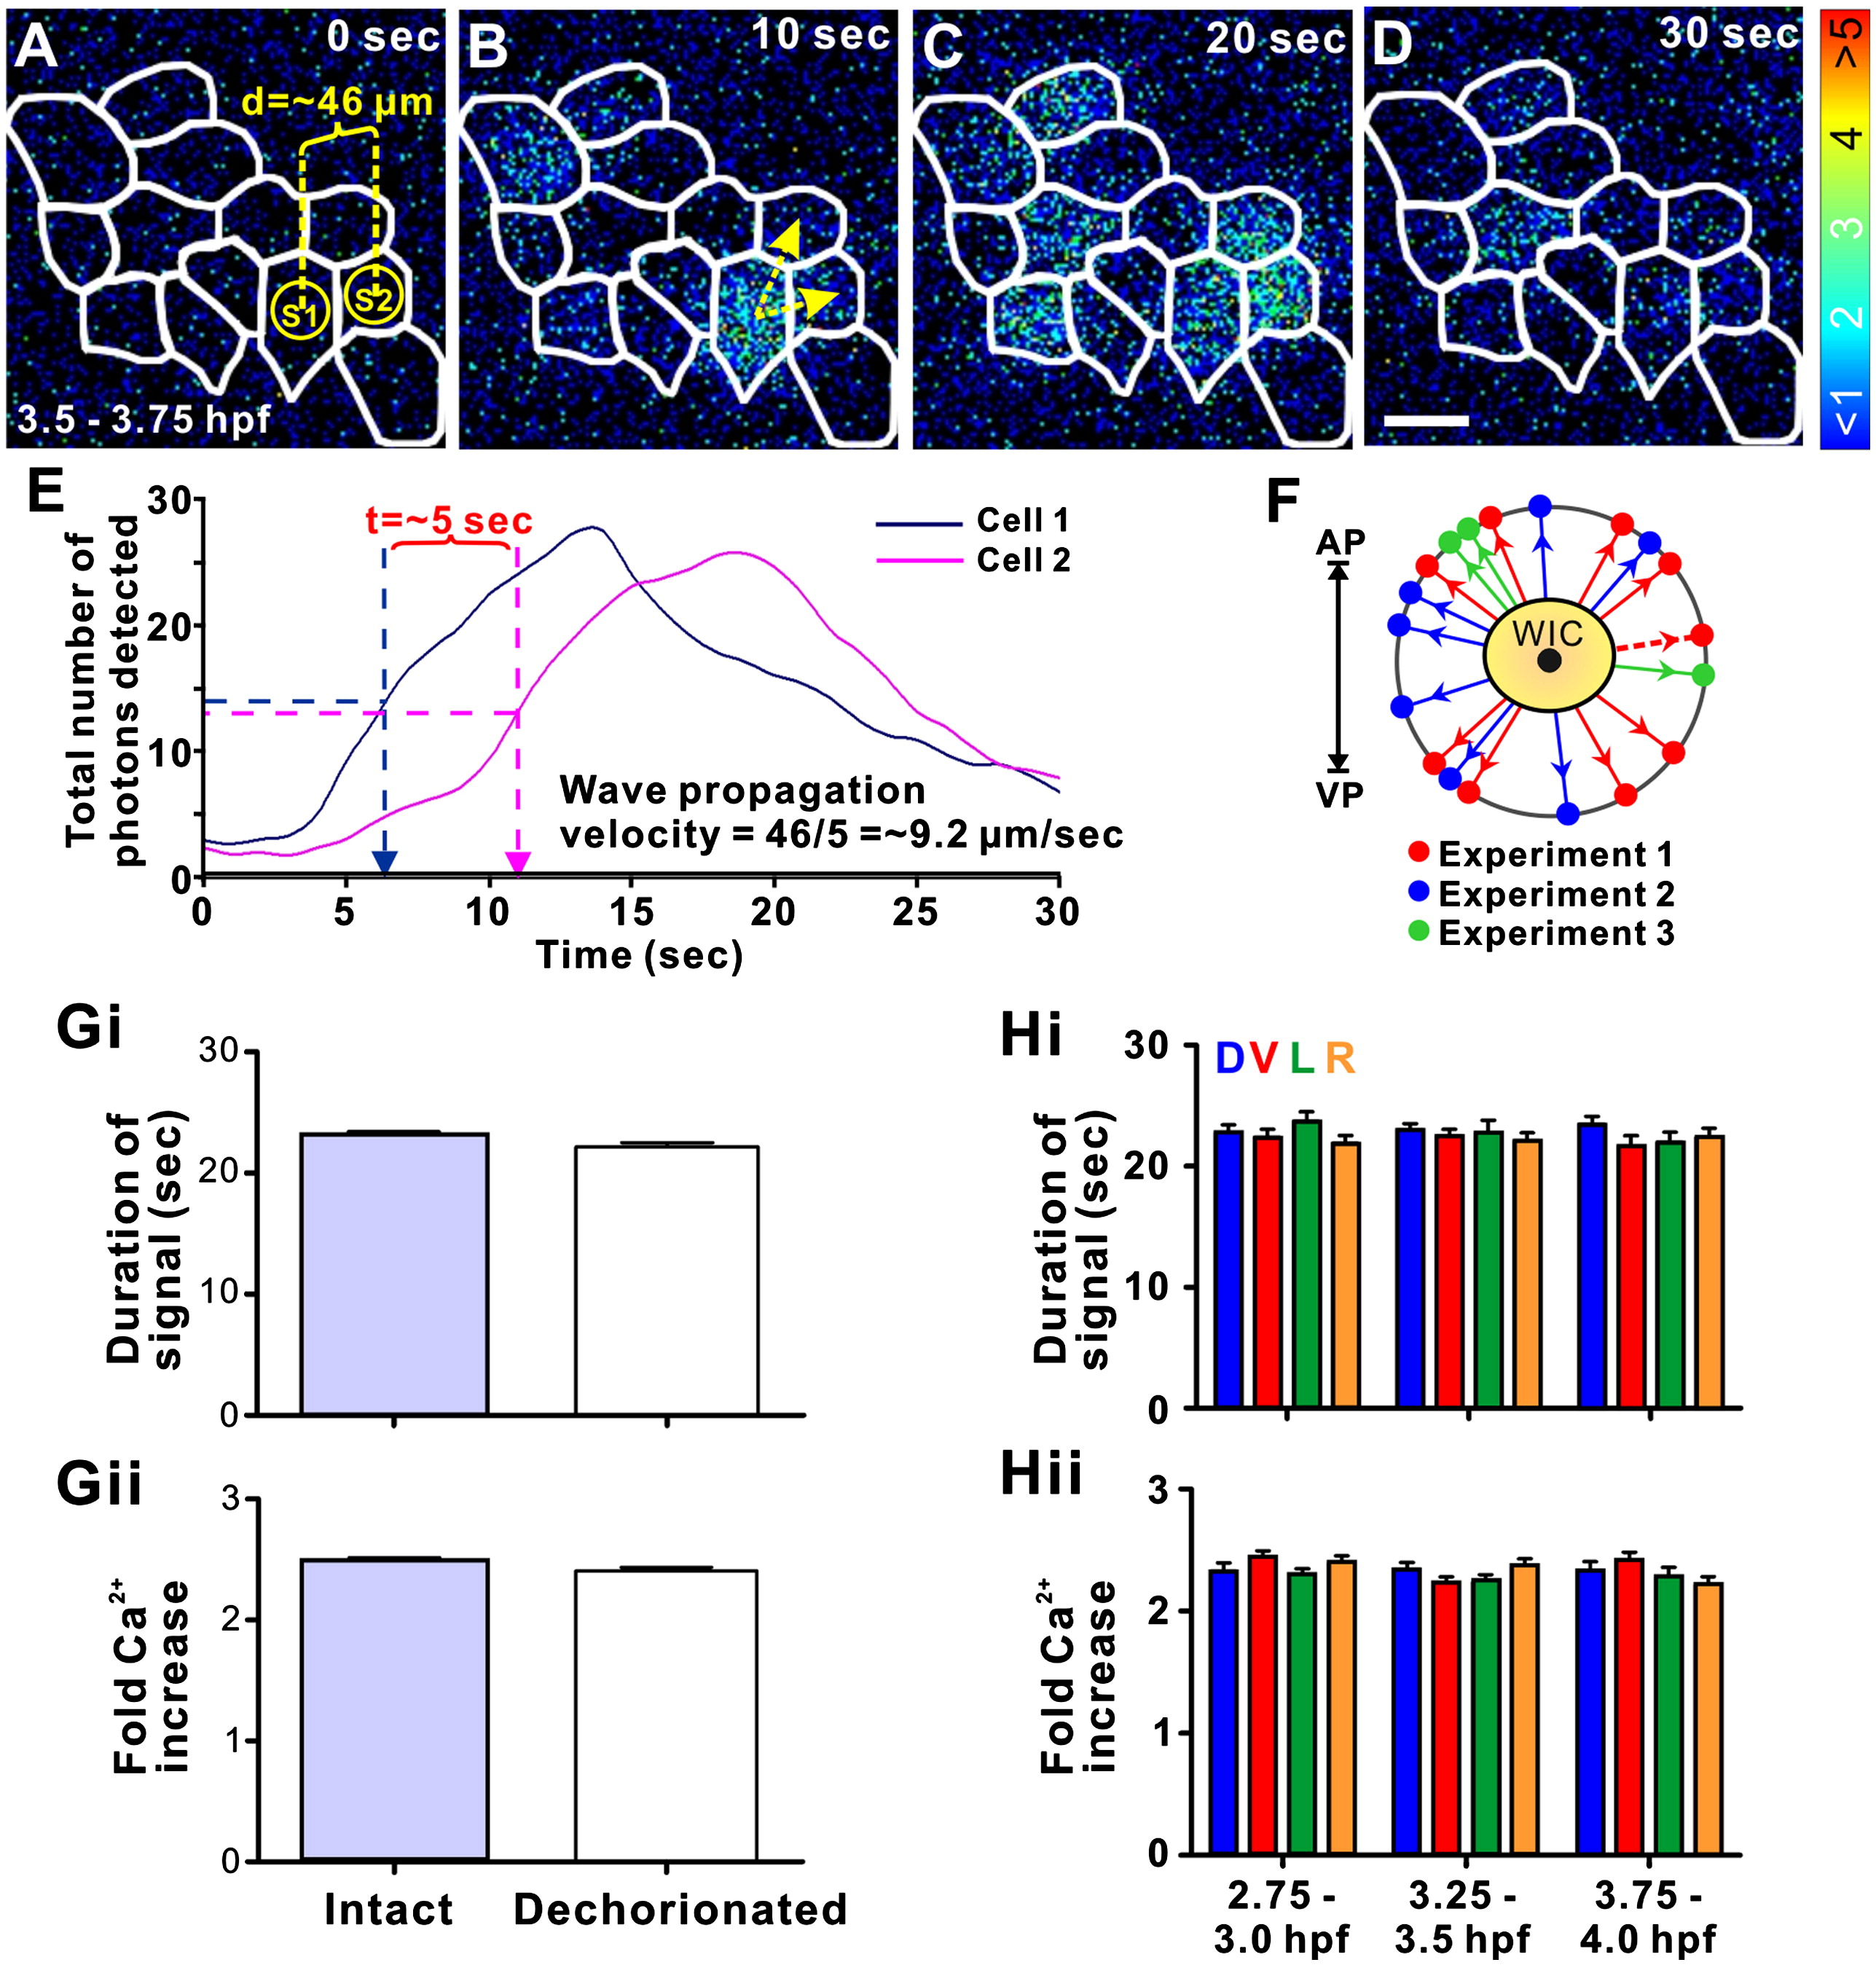
Fig. 6 Representative example of a localized intercellular Ca2+ wave, which propagates between adjoining SECs generated between 3.5–3.75 hpf. Panels A to D show the representative pattern of aequorin-generated luminescence in pseudocolor, illustrating the propagating intercellular Ca2+ wave. The borders of the SECs are highlighted in white. Each panel represents 10 s of accumulated luminescence with no time interval between consecutive panels. To calculate the velocity of wave propagation, sampling regions S1 and S2 were placed on the wave initiation cell (WIC) and one of the neighboring cells through which the wave propagates, respectively (as shown in panel A). The distance between the center of S1 and S2 is ∼ 46 μm. The direction of wave propagation is shown in panel B (yellow arrows). Scale bar = 50 μm. Panel E shows the profile of the number of photons detected in S1 and S2 plotted against time (1 s of accumulated luminescence with no time interval between steps). The time taken for the wave fronts to pass from S1 to S2 was determined from this graph, by subtracting the half-height time of the peak from the first sampling region, from that of the second. Thus, the propagation velocity (distance/time) of the Ca2+ wave in this example is ∼ 9.2 μm/s. Panel F shows the direction of propagation from the center of the WIC (with respect to the animal–vegetal axis), of 19 waves from 3 representative experiments — represented by red, blue and green arrows, respectively. The direction of propagation of the representative wave shown in panels A–D is illustrated by a dashed red arrow. (G) Comparison of the (Gi) duration and (Gii) fold Ca2+ increase of the SEC Ca2+ transients, which occur during the dorsal-biased Ca2+ signaling window, in intact and dechorionated embryos. Data are expressed as means and SEMs of a total of ∼ 200 Ca2+ transients, from both 5 intact and 5 dechorionated embryos. (H) Comparison of the (Hi) duration and (Hii) fold Ca2+ increase of the Ca2+ transients recorded in the dorsal (D; blue), ventral (V; red), left (L; green) and right (R; orange) quadrants, just before the dorsal-biased Ca2+ signaling window (DCW; i.e., from 2.75–3.0 hpf), and during the early (i.e., from 3.25–3.5 hpf) and late (i.e., 3.75–4.0 hpf) DCW. Data are expressed as means and SEMs of 30–50 Ca2+ transients per quadrant at each time point, from 5 independent experiments.
Reprinted from Developmental Biology, 327(1), Ma, L.H., Webb, S.E., Chan, C.M., Zhang, J., and Miller, A.L., Establishment of a transitory dorsal-biased window of localized Ca(2+) signaling in the superficial epithelium following the mid-blastula transition in zebrafish embryos, 143-157, Copyright (2009) with permission from Elsevier. Full text @ Dev. Biol.