
- Title
-
Coordination of development and metabolism in the pre-midblastula transition zebrafish embryo
- Authors
- Mendelsohn, B.A., and Gitlin, J.D.
- Source
- Full text @ Dev. Dyn.
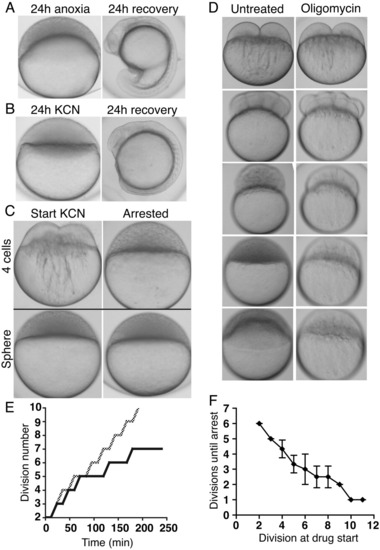
Cleavage stage embryos continue to divide despite inhibition of oxidative phosphorylation and arrest before 1,000 cells. A: Embryos at the sphere-stage were placed into anoxia or (B) KCN for 24 hr and allowed to recover for 24 hr more. C: Embryos were treated with KCN beginning at 4 cells (upper left) or the sphere-stage (lower left) and incubated for 8 hr (upper and lower right, respectively). D: Still images from time-lapse analysis of simultaneously fertilized embryos comparing untreated embryos (left column) and embryos treated with oligomycin beginning at the one-cell stage (right column). E: Comparison of cell cycle duration between untreated (gray line) and KCN-treated (solid line) embryos beginning at division 2 (four cells), representative of three independent repetitions. Measurements were made at 12-min intervals. F: Embryos were treated with oligomycin beginning after the indicated cell division (x-axis) for 8 hr, by which time arrest had occurred, and the nuclei were counted to assess the number of additional divisions completed following drug treatment (y-axis). Points are the average of three independent repetitions. Error bars are ±SD. |
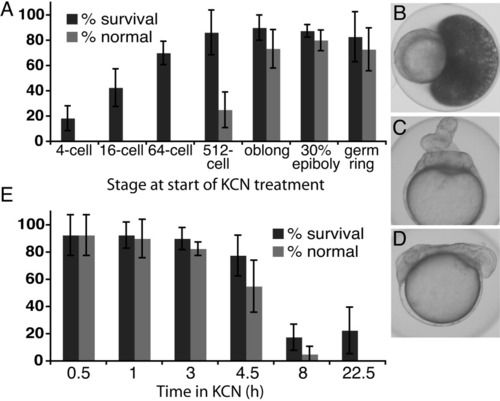
Recovery of pre-midblastula transition (MBT) embryos from arrest depends on division number and duration of arrest. A: Embryos at the indicated stage (x-axis) were placed in KCN for 24 hr and the percent of embryos that survived treatment and recovered normally 48 hr after washing of KCN was assessed. B: Representative example of the extrusion of yolk observed in embryos incubated in KCN for 24 hr beginning at the four-cell stage and then removed from KCN. C,D: Examples of the developmental abnormalities observed in embryos treated with KCN for 24 hr beginning at 64 cells, after 24 hr of recovery following removal of KCN. E: Four-cell embryos were placed in KCN for the indicated duration (x-axis), allowed to recover for 48 hr, and the percent survival and percent of embryos recovering normally was assessed. All error bars are ±SD. |
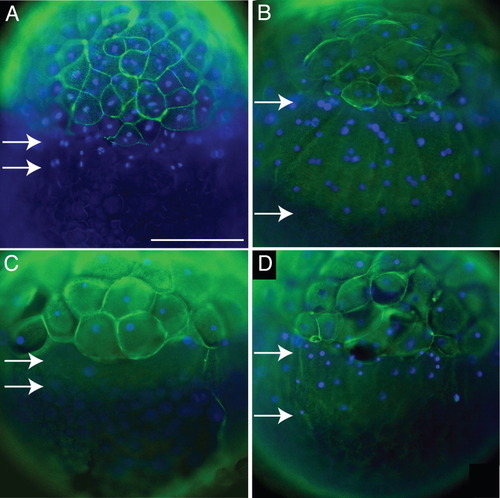
The blastoderm and yolk syncytial nuclei do not arrest in synchrony in KCN. A: Phalloidin (green) and DAPI (blue) staining of an untreated embryo indicating the distance from the blastoderm to the farthest yolk syncytial nucleus (white arrows). B: Embryo incubated in KCN for 8 hr beginning at four cells, representative of 4 independent repetitions. C: Embryo incubated in KCN for 8 hr beginning at four cells with nocodazole added after 4 hr or (D) 5 hr in KCN. Images are representative of 2 independent repetitions. Scale bar = 200 μm. |
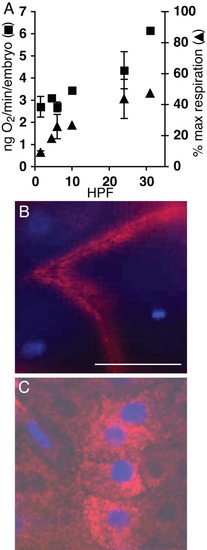
The percentage of maximal respiration that is used basally is lowest in pre-midblastula transition (MBT) embryos. A: The rate of maximal oxygen consumption was measured in embryos at different stages by treating embryos with the mitochondrial uncoupler CCCP (squares, left y-axis). The percentage of maximal oxygen consumption that is consumed basally was calculated for each sample and averaged (triangles, right y-axis). All error bars are ±SD. B,C: Live embryos at 16 cells (B) or sphere-stage (C) were stained with MitoTracker dye (red) and Hoescht (blue) and imaged by fluorescent microscopy. Images are representative of five independent repetitions. Scale bar = 100 μm. |
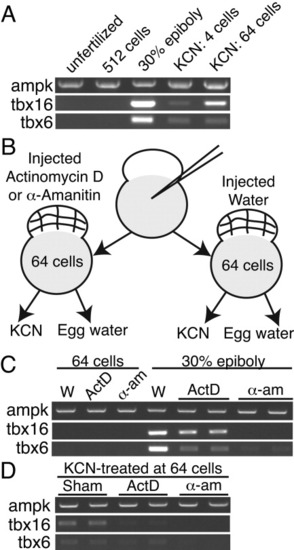
Zygotic transcription is prematurely activated by the inhibition of oxidative phosphorylation. A: cDNA prepared from untreated pre-midblastula transition (MBT; unfertilized and 512 cells) and post-MBT (30% epiboly) embryos or from embryos treated with KCN and arrested at 256-512 cells (KCN at 4 cells and KCN at 64 cells), was assessed by reverse transcriptase-polymerase chain reaction (RT-PCR) analysis for zygotic expression of the transcription factors tbx16 and tbx6. The maternal transcript ampkα1 was amplified for comparison across cDNA samples. B: Schematic of the experimental approach to assess the chemical inhibition of transcription. One-cell embryos were injected with water or the transcription inhibitors actinomycin D (ActD) or α-amanitin (α-am) and beginning at 64 cells were incubated in KCN or egg water. RNA was collected at 64 cells to assess the presence of maternal transcripts and when untreated embryos reached 30% epiboly to detect zygotic transcripts. C: The presence of two zygotic transcripts was assessed by RT-PCR analysis at 64 cells and 30% epiboly in unarrested embryos injected with transcriptional inhibitors as indicated. W, water-injected. D: The transcriptional activation of tbx16 and tbx6 was determined by RT-PCR in embryos treated with KCN beginning at 64 cells and collected when siblings reached 30% epiboly. Each RT-PCR sample constitutes 10 pooled embryos. |
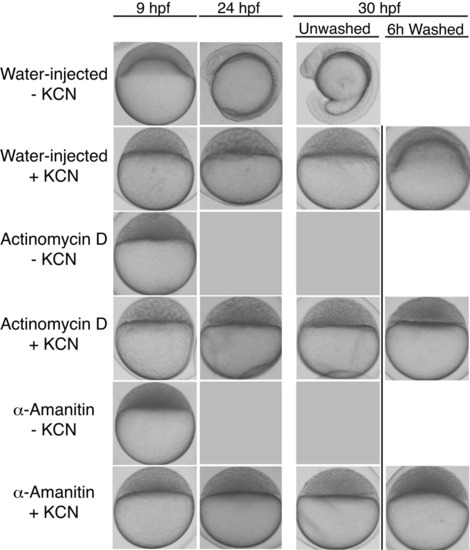
Inhibition of transcription does not prevent arrest or survival in KCN. Embryos injected with water, actinomycin D, or α-amanitin were incubated in normal egg water or in KCN beginning at 64 cells and their response and survival were observed. After 24 hr, KCN was washed off of some arrested embryos to permit recovery and these embryos were observed 6 hr later. Gray panels indicate that embryos in this condition had died and lysed. Images are representative of two independent repetitions. |
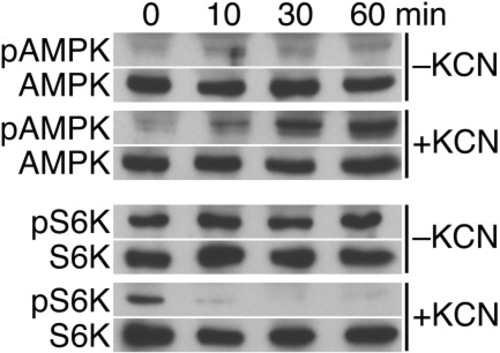
The AMPK pathway is activated by KCN in pre-midblastula transition (MBT) embryos. Immunoblot analysis of four-cell embryos incubated in normal egg water or KCN for 0, 10, 30, and 60 min assessing the phosphorylation status of AMPK and S6K compared with total levels of each protein. Each time point used 20 embryos, and results are representative of three independent repetitions. |