
Fig. 1
- ID
- ZDB-FIG-080702-16
- Publication
- Mendelsohn et al., 2008 - Coordination of development and metabolism in the pre-midblastula transition zebrafish embryo
- Other Figures
- All Figure Page
- Back to All Figure Page
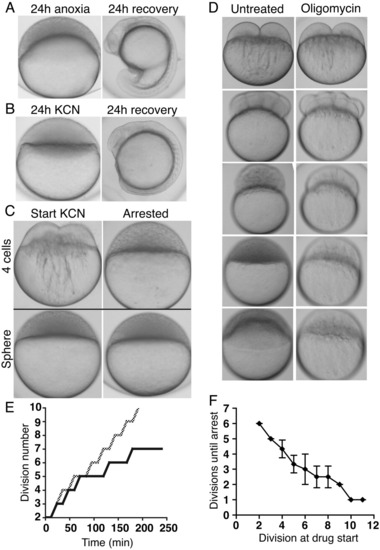
Cleavage stage embryos continue to divide despite inhibition of oxidative phosphorylation and arrest before 1,000 cells. A: Embryos at the sphere-stage were placed into anoxia or (B) KCN for 24 hr and allowed to recover for 24 hr more. C: Embryos were treated with KCN beginning at 4 cells (upper left) or the sphere-stage (lower left) and incubated for 8 hr (upper and lower right, respectively). D: Still images from time-lapse analysis of simultaneously fertilized embryos comparing untreated embryos (left column) and embryos treated with oligomycin beginning at the one-cell stage (right column). E: Comparison of cell cycle duration between untreated (gray line) and KCN-treated (solid line) embryos beginning at division 2 (four cells), representative of three independent repetitions. Measurements were made at 12-min intervals. F: Embryos were treated with oligomycin beginning after the indicated cell division (x-axis) for 8 hr, by which time arrest had occurred, and the nuclei were counted to assess the number of additional divisions completed following drug treatment (y-axis). Points are the average of three independent repetitions. Error bars are ±SD. |