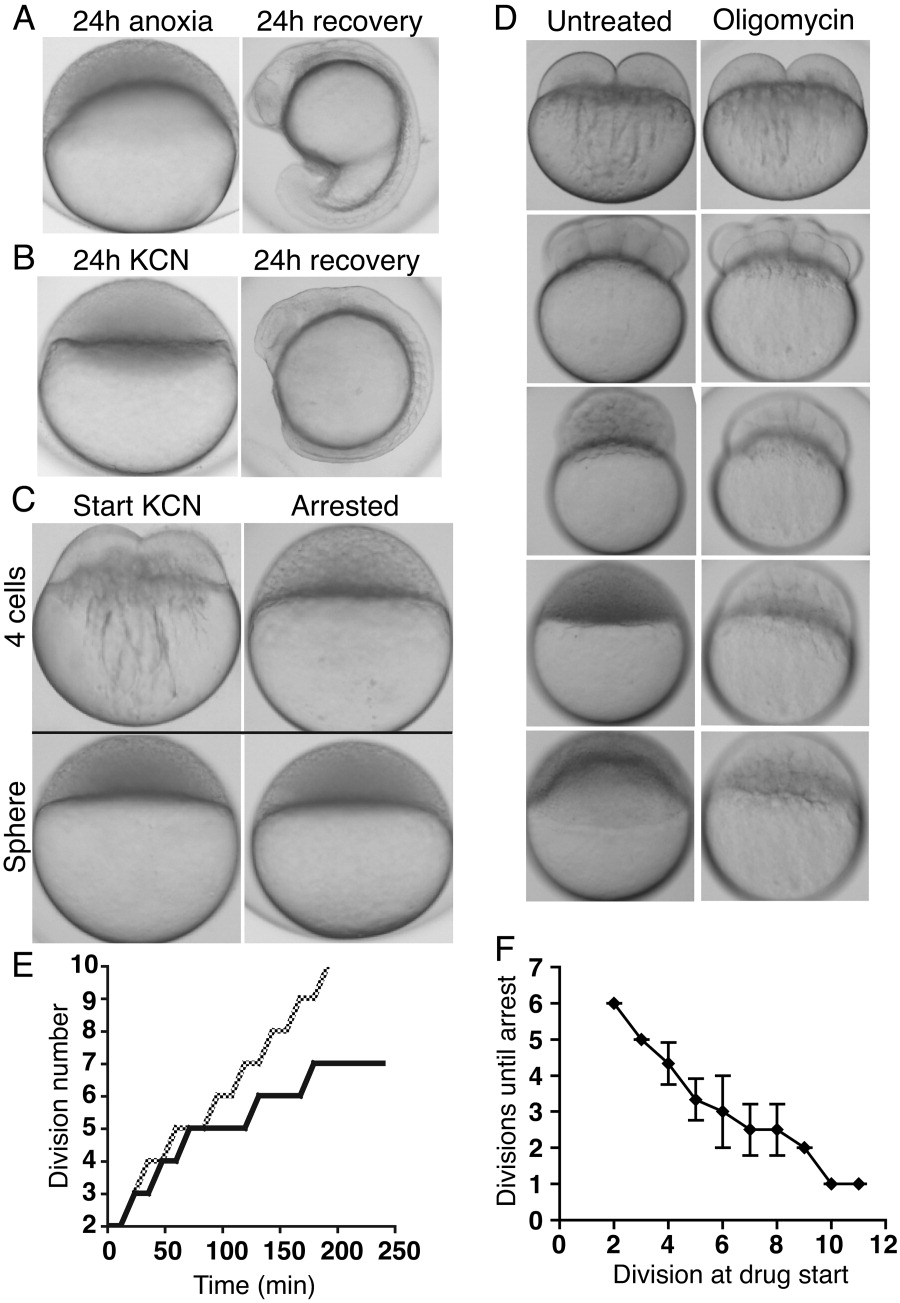
Fig. 1 Cleavage stage embryos continue to divide despite inhibition of oxidative phosphorylation and arrest before 1,000 cells. A: Embryos at the sphere-stage were placed into anoxia or (B) KCN for 24 hr and allowed to recover for 24 hr more. C: Embryos were treated with KCN beginning at 4 cells (upper left) or the sphere-stage (lower left) and incubated for 8 hr (upper and lower right, respectively). D: Still images from time-lapse analysis of simultaneously fertilized embryos comparing untreated embryos (left column) and embryos treated with oligomycin beginning at the one-cell stage (right column). E: Comparison of cell cycle duration between untreated (gray line) and KCN-treated (solid line) embryos beginning at division 2 (four cells), representative of three independent repetitions. Measurements were made at 12-min intervals. F: Embryos were treated with oligomycin beginning after the indicated cell division (x-axis) for 8 hr, by which time arrest had occurred, and the nuclei were counted to assess the number of additional divisions completed following drug treatment (y-axis). Points are the average of three independent repetitions. Error bars are ±SD.
Image
Figure Caption
Acknowledgments
This image is the copyrighted work of the attributed author or publisher, and
ZFIN has permission only to display this image to its users.
Additional permissions should be obtained from the applicable author or publisher of the image.
Full text @ Dev. Dyn.

