
- Title
-
Fgf signals from a novel signaling center determine axial patterning of the prospective neural retina
- Authors
- Picker, A., and Brand, M.
- Source
- Full text @ Development
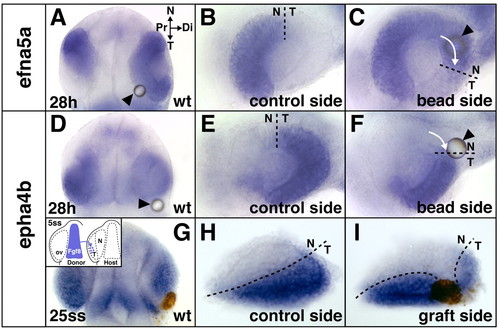
Temporal shifts in retinal patterning induced by ectopic Fgf8. (A-F) Shifts in retinal NT gene expression at the 28 hour stage after Fgf8-bead implantation at the 5-somite stage into wild-type (wt) embryos: expansion of the nasal marker efna5a (A,C) and reduction of the temporal marker epha4b (D,F) compared with control side of the same embryos (B,E). (G-I) Reduction of temporal epha4b expression in a wild-type embryo at the 25-somite stage after ectopic transplantation of cells from the telencephalic Fgf8-domain into the optic vesicle (ov, brown staining) at the 5-somite stage (I) compared with control side of the same embryo (H) (see inset in G for grafting schematic). Arrows indicate directionality of expansion/reduction. Location of the bead is indicated by arrowheads. (A,D,G) Dorsal views with anterior towards the top, orientation as indicated in A; (B,C,E,F,H,I) flat-mounts of dissected eyes. (C,F,I) Digitally inverted images. N, nasal; T, temporal; Pr, proximal; Di, distal. Dashed lines indicate the retinal NT boundary. |
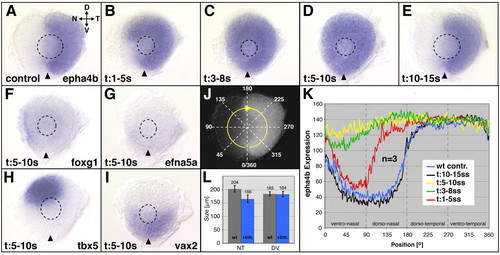
Nasal shifts in retinal patterning after Fgf-receptor (Fgfr) inhibition. (A-E) epha4b gene expression at the 28 hour stage after Fgfr inhibitor treatment between the 1- and 5-somite stage results in a partial expansion of epha4b from the temporal half into the nasal retina (B). Treatment between the 3- and 8-somite stage (C), and 5- and 10-somite stage (D) induces expansion of epha4b expression throughout the retina. Treatment between the 10- and 15-somite stage has no effect on epha4b expression (E). Mock-treated control in A. Nasal expression of foxg1 (F) and efna5a (G) is absent after treatment between the 5- and 10-somite stage (compare with Fig. 3A,C). (H) Dorsal tbx5 expression is shifted nasally (compare with Fig. 3G), vax2 expression is not altered (I) (compare with Fig. 3I). (K) Gene expression intensity profiling of epha4b in the retina at 28 hours along a clockwise 360° profiling trajectory (J) after Fgfr-inhibitor treatment (mean values, n=3 eyes): comparison of epha4b expression gradients shows the peak in the requirement for Fgfr signaling in retinal NT patterning during the 5- and 10-somite stage (yellow). Treatment periods are color-coded as indicated. Axial positions (in radial degrees of a circle; 0°/360°=ventromedial retina) along the profiling trajectory (x-axis) are plotted against the expression level (mean values of three eyes) in gray values on an 8-bit scale (y-axis). (L) Eye size after Fgfr-inhibitor-treatment along the NT and DV axis compared with wild-type control eyes. Sizes (μm) are mean values (n=9). Images are flat-mounts of dissected eyes, orientation as indicated in A. Dashed outlines indicate the position of the lens. Arrowheads indicate the ventralmost position of the eye marked by the choroid fissure. D, dorsal; V, ventral; N, nasal; T, temporal. EXPRESSION / LABELING:
|
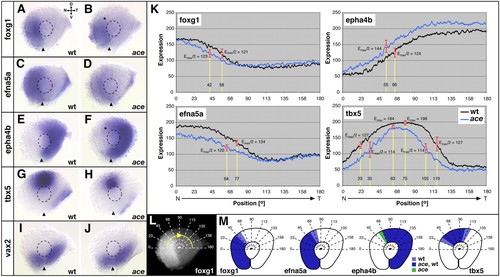
Nasal shifts in retinal patterning in fgf8-mutant ace embryos. (A-J) In situ hybridizations of wild-type and the fgf8-mutant acerebellar (ace) at 28 hours. Expression of foxg1 is confined to the nasal retina but not expressed to the dorsal-most point in wild type (A) and reduced (asterisk) in the dorsonasal retina of ace mutants (B). Expression of efna5a covers the complete nasal retina in wild type (C) and is reduced overall in ace (D). Expression of epha4b is confined to the temporal retinal half of the wild type (E), is fully complementary to efna5a (C) and expands (asterisk) into the nasal retina in ace (F). Expression of tbx5 is confined to the dorsomedial retina in the wild type (G) and reduced in its nasotemporal extent in ace (H). vax2 is expressed in the ventral retina of the wild type (I) and unaffected in ace (J). (K-M) Intensity profiling of gene expression in the dorsal retina along a clockwise 180° trajectory (L). (K) Graphs of intensity profiles of wild type (black) and ace mutant (blue) retinae (mean values, n=8 eyes/gene): in the wild type, foxg1 is expressed in a nasal-to-temporal decreasing gradient, which is shifted nasally in ace (16° offset in Emax/2). The nasal-to-temporal decreasing gradient of efna5a in the wild type is reduced overall and shifted nasally in ace (13° offset in Emax/2). The nasal-to-temporal increasing gradient of epha4b in the wild type is nasally shifted owing to upregulation of expression in ace (11° offset in Emax/2). The bell-shaped expression gradient of tbx5 in the wild type is steeper in ace (13° offset in Emax/2 nasally and temporally) and the central peak of tbx5 expression, –Emax value-, is shifted nasally in the mutant (radial offset=12°). Axial positions in radial degrees along the profiling trajectory (x-axis) are plotted against the expression level in gray values on an 8-bit scale (y-axis). Drop-lines in K indicate points of half-maximal Emax/2 and maximal Emax expression; corresponding expression values, radial positions and representative standard deviations (error bars) are indicated. (M) Schematic representations of gene expression domains. Boundaries are deduced from Emax/2 values in K. Extent of expression domains in wild type and ace are color-coded as indicated. Orientation of eyes as indicated in A. D, dorsal, V, ventral, N, nasal, T, temporal. Broken outlines indicate the lens. Arrowheads indicate the ventralmost position of the eye. EXPRESSION / LABELING:
|
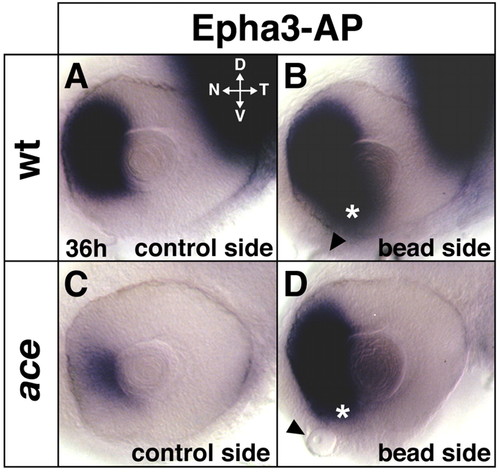
Rescue of retinal patterning in the ace mutant by Fgf8-soaked beads. In 36-hour embryos, alkaline-phosphatase-tagged Epha3 protein detects nasal expression of Efna-ligands in the wild type (A), which is reduced in ace (C) and rescued after Fgf8-bead implantation at the 10-somite stage into the forebrain (D). Bead implantation also induces ectopic Efna-ligand expression in the ventronasal retina (asterisks in B,D). The sites of the beads are indicated by arrowheads. Images are flat-mounts of dissected eyes, orientation as indicated in A. (B,D) Digitally inverted images. D, dorsal; V, ventral; N, nasal; T, temporal. |
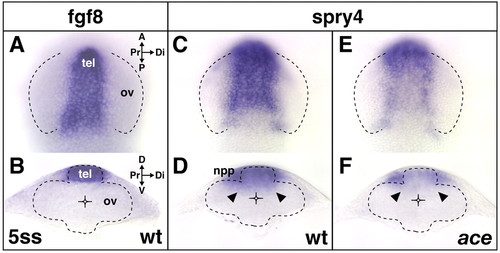
Expression of fgf8 and the Fgf-target gene spry4, during early eye development. At the 5-somite stage, fgf8 and spry4 are co-expressed in the telencephalon dorsal to the diencephalic evagination zone of the optic vesicles (A-D) in wild-type embryos. spry4 expression extends from the telencephalon into the diencephalon, including the proximal future nasal part of the evaginating optic vesicle (arrowheads in D) and is found in the nasal placode precursor cells (npp) (D), surrounding the telencephalon at this stage. (E,F) In ace, telencephalic and diencephalic spry4 expression is reduced (arrowheads in F), but expression in the nasal placode precursor cells is unaffected. Orientation of dorsal views (A,C,E,) indicated in A; orientation of transverse sections at a intermediate anterior-posterior level of the optic vesicle (B,D,F) indicated in B. A, anterior; P, posterior; Pr, proximal; Di, distal; D, dorsal; V, ventral; tel, telencephalon; ov, optic vesicle; npp, nasal placode precursors. Broken lines represent outlines of the optic vesicle (A,C,E,) and neural tube (B,D,F). EXPRESSION / LABELING:
|
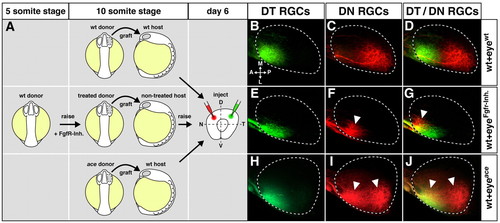
Topographic shifts of tectal RGC projections from eyes with altered Fgf signaling. Retinotectal topography in chimeric larvae after transplantation of optic vesicles with Fgf-dependent alterations in NT patterning. (A) Transplantation scheme: optic vesicles were grafted from mock-treated wild-type donors to wild-type hosts (top), from Fgfr-inhibitor-treated donor embryos (treatment: 5- to 10-somite stage) to non-treated hosts (middle) and from ace donors to wild-type hosts (bottom) at the 10-somite stage. Chimeras were fixed at day 6 and retinal ganglion cell (RGC) axons anterogradely double-labeled by DiI (green) and DiO (red) in the dorsotemporal (DT) and dorsonasal (DN) quadrants. (B-D) In control transplantations, DT RGCs form an anterior termination zone (TZ) and DN RGCs form a posterior TZ that is non-overlapping and correct, according to their NT position in the retina (n=6/6). (E-G) Eyes from Fgfr-inhibitor-treated donor embryos display a full temporalization of RGC axon mapping: DT RGCs correctly terminate in an anterior TZ, while DN RGCs misproject to an ectopic anterior TZ (n=5/5). (H-J) Eyes from ace donor embryos display a partial temporalization of RGC axon mapping: DT RGCs correctly terminate anteriorly, while DN RGCs form a second, ectopic anterior TZ (n=5/6). White arrowheads indicate misprojections compared with wild type. Orientation of the tectum (dorsal views) as indicated in B. (B-J) Maximum-intensity projections of confocal image stacks. Broken outlines indicate the tectal neuropil. A, anterior; L, lateral; M, medial; P, posterior. |
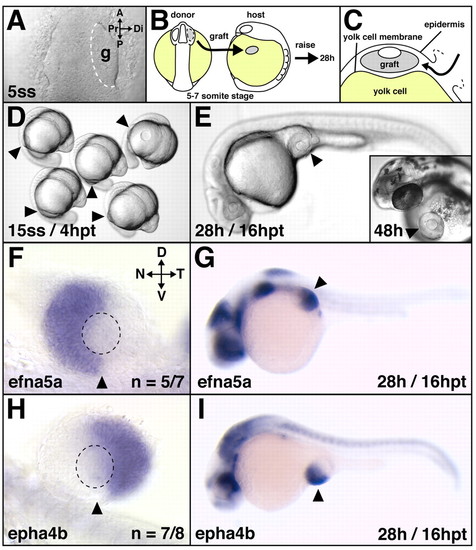
Correct retinal NT patterning after heterotopic optic vesicle transplantation. (A-C) Transplantation scheme. At the 5- to 7-somite stage, optic vesicles were transplanted from the forebrain of donor embryos onto the yolk cell of hosts (B) by slipping the graft in between the locally-opened epidermis and the yolk cell membrane (C). A live image of the anterior neural keel (dorsal view) in shown in A, (D,E) Live host embryos: heterotopic grafts develop and differentiate on the yolk cell and form eyes of normal morphology. (F-I) Retinal NT patterning after heterotopic transplantation at 28 hours of development: in grafts, the nasal expression domain of efna5a (F) and the temporal expression domain of epha4b (H) are established and maintained normally in the ectopic situs (G,I) of the embryo. (F,H) Flat-mounts of dissected eyes, orientation as indicated in F. Arrowheads indicate the implantation site (D,E,G,I) and the ventralmost position of the eye (F,H). Broken outline in A indicates grafted tissue; in F,H it indicates the lens. A, anterior; P, posterior; g, graft; hpt, hours post-transplantation; D, dorsal; V, ventral; N, nasal; T, temporal; Pr, proximal; Di, distal. |