- Title
-
Maternal and zygotic activity of the zebrafish ogon locus antagonizes BMP signaling
- Authors
- Miller-Bertoglio, V., Carmany-Rampey, A., Fürthauer, M., Gonzalez, E.M., Thisse, C., Thisse, B., Halpern, M.E., and Solnica-Krezel, L.
- Source
- Full text @ Dev. Biol.
|
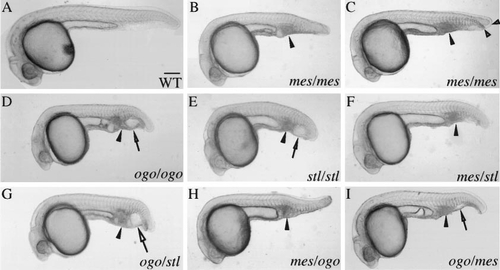
mes, ogo, and stl fail to complement. (A) WT (1 day), (B,C) mes, (D) ogo, and (E) stl homozygotes (1 day) are typically characterized by a shortened body axis, an accumulation of cells in the ventral tail (arrowhead), and a partial duplication of the ventral fin. In addition, ogo and stl homozygotes have smaller heads and an enlarged vesicle in the ventral tail (arrow). (B) Progeny of a mes/+ female. (C) Progeny of mes/mes females exhibit a more prominent duplicated ventral fin (open arrowheads). (F–I) mes, ogo, and stl mutations fail to complement. All matings produced transheterozygous mutant progeny (Table 1). (H and I) A maternal enhancement of mutant phenotypes was revealed in reciprocal crosses. The enlarged tail vesicle (open arrow) was not present in the (H) ogo/mes progeny of a mes/+ female, but was observed in (I) progeny of ogo/+ females. The phenotype of ogo/mes transheterozygotes was of intermediate severity compared to (C) mes and (D) ogo homozygotes, suggesting that mes is a hypomorphic allele. The maternal allele is given first in the genotype designations. Scale bar, 200 μm for (A–I). |
|
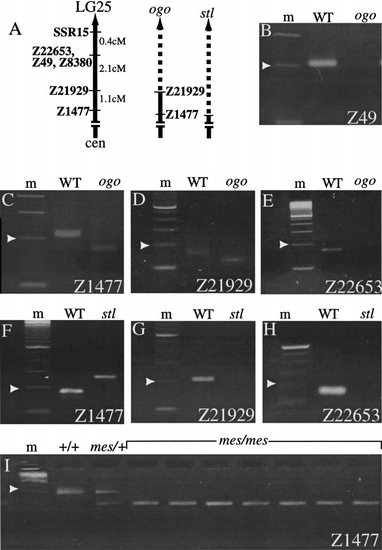
ogo maps to linkage group 25. (A) Genetic map of the distal end of LG25 with polymorphic (Z) markers indicated (Knapik et al., 1998; http://zebrafish.mgh.harvard.edu). The extent of the ogo and stl deficiencies (dashed lines) are approximated. (B) Linkage of ogom60 to LG25 was initially established by the absence of Z49 in ogom60 genomic DNA. (C–E) Analyses of other LG25 markers suggest that the proximal breakpoint of the ogom60 deletion lies between proximal markers (C and D) Z1477 and Z21929 and the distal marker (E) Z22653. The proximal breakpoint of stlb180 lies between (F and G) Z1477 and Z21929. Distal breakpoints could not be determined since markers distal to Z21929 were absent in all three alleles. (I) mes was independently mapped to LG25 through linkage to Z1477. Amplification products for a subset of WT siblings (+/+ and mes/+) and mutant (mes/mes) diploid embryo genomic DNA samples are shown. m, marker lane. Arrowhead, 200 bp. |
|
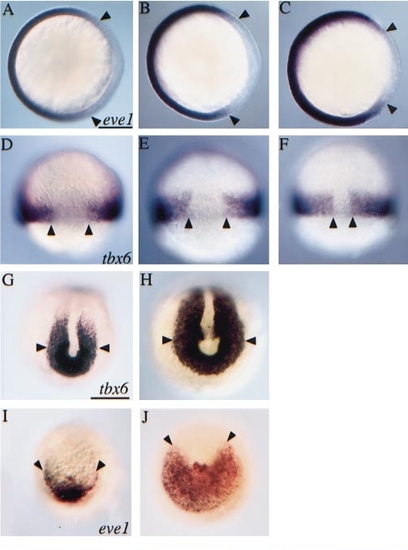
Maternal and zygotic depletion of gene activity affects markers of dorsal–ventral patterning. (A–C) Animal pole view with dorsal to the right. (A) The dorsal extent of eve1 expression (arrowheads) was unaffected in embryos (70% epiboly) derived from ogom60/+ intercrosses or in (B) 75% of embryos (n = 84) from a cross between ogom60/+ males and ogom60/ogotm305 females. (C) The remaining 25% (presumed ogom60/ogom60) had dorsally expanded eve1 expression. (D–F) Dorsal views. (D) The extent of tbx6 expression (arrowheads) was unaffected in embryos (80% epiboly) from ogom60/+ intercrosses or in (E) 71% of the progeny (n = 34) of ogom60/ogotm305 females crossed to ogom60/+ males. (F) A dorsalward expansion of tbx6 expression was observed in the remaining 29%. (G–J) Posterior views. Compared to (G, I) their WT siblings, expression of (H) tbx6 (tailbud stage) and (J) eve1 (2 somite stage) was expanded in ogom60 mutant tailbuds. Scale bars, 200 μm. |
|
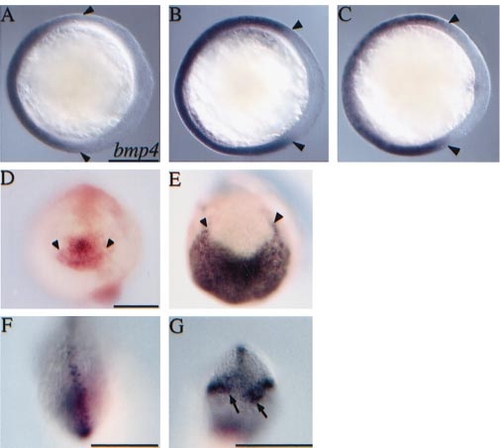
ogom60 bmp4 expression domains are expanded in ogo mutant embryos. (A–C) Animal pole view with dorsal to the right. (A) The dorsal extent of bmp4 expression (arrowheads) was unaffected in 77% of embryos (70% epiboly) derived from ogom60 /+ intercrosses but was expanded in (B) the remaining 23%, presumed to be ogom60 /ogom60. (C) 100% of embryos from ogom60 /ogotm305 intercrosses displayed a dorsalward expansion of bmp4 expression. (D and E) Posterior views. Compared to their (D) WT siblings, bmp4 expression was highly expanded in the tailbuds of (E) ogom60 /ogom60 embryos (8 somites). At 20 somites, bmp4 was expressed in (F) the single ventral fin fold of WT embryos and (G) the multiple, ectopic fin folds (arrows) of ogom60 /ogom60 embryos. Scale bars, 200 μm. |
|
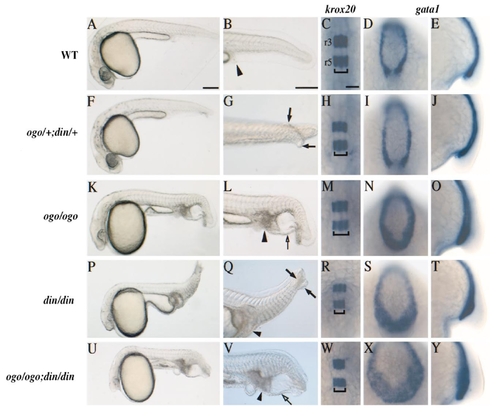
ogon and chordin encode partially overlapping functions. Crosses between ogom60/+;dintt250/+ double heterozygotes resulted in five phenotypic classes: (A–E) WT, (F–J) ogom60/+;din1/+, (K–O) ogom60, (P–T) din, and (U–Y) double mutant. The caudal cell accumulation (arrowhead), duplicated tail fin (arrows), and ventral tail vesicle (open arrow) are characteristic of the mutant classes. In situ hybridization (18 hpf) using probes for krox20, expressed in hindbrain rhombomeres 3 and 5 (r3 and r5), and gata1, expressed in blood cells of the ventral tail, shows that the brain of (W) ogom60/ogom60;din/din double mutants is similar in size to that of (R) din homozygotes and that the increase in blood cells was slightly greater in (X,Y) the double mutant compared to either single mutant. krox20 expression is shown in dorsal views and gata1 expression is shown in dorsal and lateral tailbud views. Scale bars for live embryos, 200 and 50 μm for in situ hybridization preparations. |
|
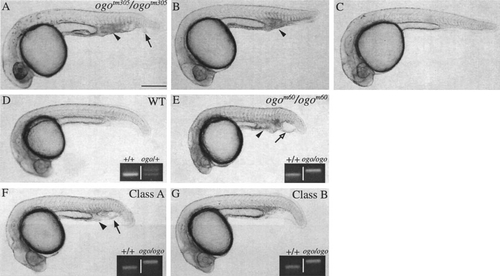
Mutant phenotypes are suppressed by injected chordin RNA. (A–C) Progeny of ogotm305/ogotm305 intercrosses injected with (A) GFP RNA or (B and C) a mixture of chordin and GFP RNA. Chordin-injected embryos were (B) partially or (C) fully rescued. (D–G) Progeny of ogom60/+ intercrosses injected with (D and E) GFP RNA or (F and G) a mixture of chordin and GFP RNA. (F) Partial rescue class A. (G) Partial rescue class B. Insets (D–G) show PCR analyses of the closely linked polymorphic marker (Z6924; left lane WT reference) used to confirm the genotype (right lane) of the depicted embryo. The PCR product was 200 bp for WT (EK) and 220 bp for ogo (HK). Indicated are the cell accumulation (arrowhead), the duplicated fin (arrow), and the vesicle (open arrow) characteristic of the mutant ventral tail. Scale bar, 250 μm. |
|
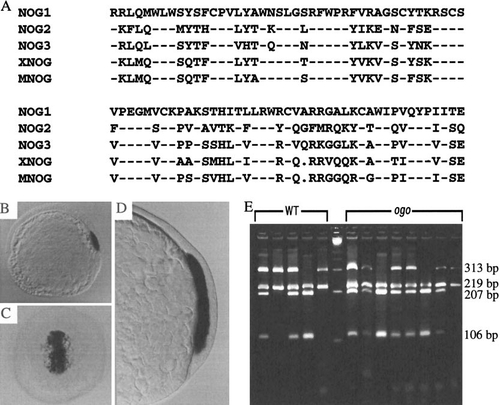
A dorsally expressed zebrafish noggin gene does not correspond to ogo. (A) Comparison of the predicted, partial amino acid sequences of Noggin1, Noggin2, and Noggin3 with the Xenopus (XNOG) and mouse (MNOG) proteins. Dashes indicate identical residues. Dots indicate gaps introduced to optimize the alignment. (B) At the onset of gastrulation, nog1 is expressed in the dorsal embryonic shield. (C and D) As gastrulation proceeds (70% epiboly), nog1 expression is maintained in the involuting mesoderm. (B and D) Lateral views. (C) Dorsal view. (E) A restriction polymorphism in nog1 is not linked to ogo. A nog1 PCR fragment (532 bp) amplified from genomic DNA of individual progeny from an ogotm305/+ (HK/EK) map cross was digested with PvuII to produce 219- and 313-bp fragments. The WT (EK) 313-bp fragment contains an additional PvuII site that is not present in the HK background of ogo and yields 207- and 106-bp fragments. Lanes 1–5 and 7–14 are PvuII digests of nog1 PCR products amplified from genomic DNA of individual WT (EK) and ogo (HK) embryos, respectively. Lane 6 is a High–Low molecular weight marker (Minnesota Molecular). |
Reprinted from Developmental Biology, 214(1), Miller-Bertoglio, V., Carmany-Rampey, A., Fürthauer, M., Gonzalez, E.M., Thisse, C., Thisse, B., Halpern, M.E., and Solnica-Krezel, L., Maternal and zygotic activity of the zebrafish ogon locus antagonizes BMP signaling, 72-86, Copyright (1999) with permission from Elsevier. Full text @ Dev. Biol.

