
|
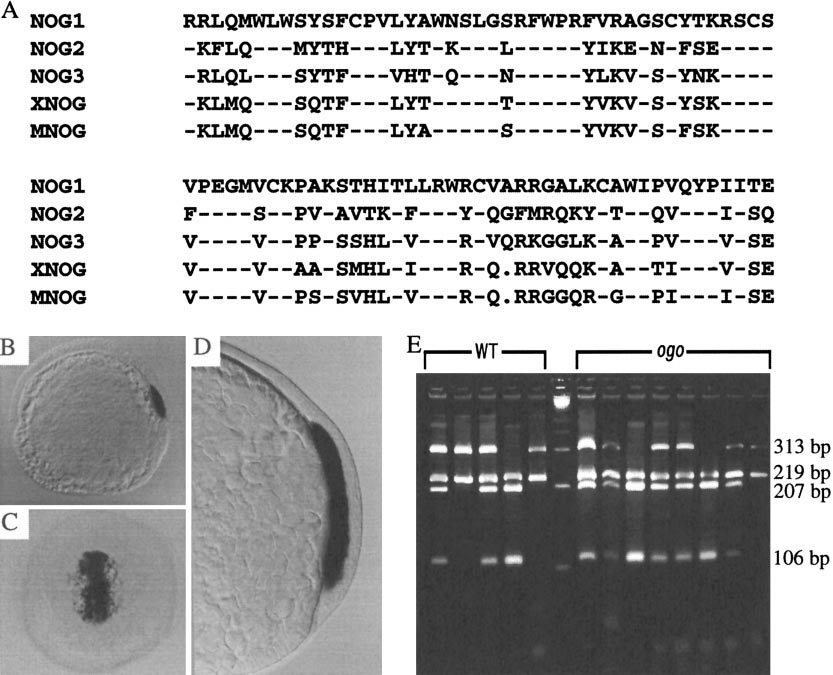
Fig. 7 A dorsally expressed zebrafish noggin gene does not correspond to ogo. (A) Comparison of the predicted, partial amino acid sequences of Noggin1, Noggin2, and Noggin3 with the Xenopus (XNOG) and mouse (MNOG) proteins. Dashes indicate identical residues. Dots indicate gaps introduced to optimize the alignment. (B) At the onset of gastrulation, nog1 is expressed in the dorsal embryonic shield. (C and D) As gastrulation proceeds (70% epiboly), nog1 expression is maintained in the involuting mesoderm. (B and D) Lateral views. (C) Dorsal view. (E) A restriction polymorphism in nog1 is not linked to ogo. A nog1 PCR fragment (532 bp) amplified from genomic DNA of individual progeny from an ogotm305/+ (HK/EK) map cross was digested with PvuII to produce 219- and 313-bp fragments. The WT (EK) 313-bp fragment contains an additional PvuII site that is not present in the HK background of ogo and yields 207- and 106-bp fragments. Lanes 1–5 and 7–14 are PvuII digests of nog1 PCR products amplified from genomic DNA of individual WT (EK) and ogo (HK) embryos, respectively. Lane 6 is a High–Low molecular weight marker (Minnesota Molecular).
Reprinted from Developmental Biology, 214(1), Miller-Bertoglio, V., Carmany-Rampey, A., Fürthauer, M., Gonzalez, E.M., Thisse, C., Thisse, B., Halpern, M.E., and Solnica-Krezel, L., Maternal and zygotic activity of the zebrafish ogon locus antagonizes BMP signaling, 72-86, Copyright (1999) with permission from Elsevier. Full text @ Dev. Biol.