
|
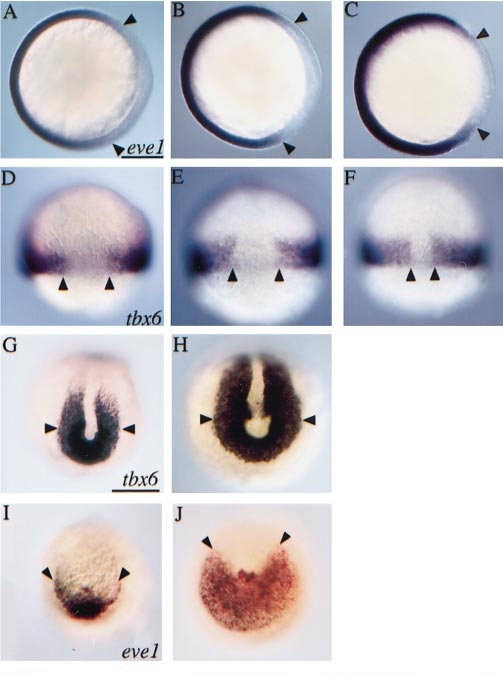
Fig. 3 Maternal and zygotic depletion of gene activity affects markers of dorsal–ventral patterning. (A–C) Animal pole view with dorsal to the right. (A) The dorsal extent of eve1 expression (arrowheads) was unaffected in embryos (70% epiboly) derived from ogom60/+ intercrosses or in (B) 75% of embryos (n = 84) from a cross between ogom60/+ males and ogom60/ogotm305 females. (C) The remaining 25% (presumed ogom60/ogom60) had dorsally expanded eve1 expression. (D–F) Dorsal views. (D) The extent of tbx6 expression (arrowheads) was unaffected in embryos (80% epiboly) from ogom60/+ intercrosses or in (E) 71% of the progeny (n = 34) of ogom60/ogotm305 females crossed to ogom60/+ males. (F) A dorsalward expansion of tbx6 expression was observed in the remaining 29%. (G–J) Posterior views. Compared to (G, I) their WT siblings, expression of (H) tbx6 (tailbud stage) and (J) eve1 (2 somite stage) was expanded in ogom60 mutant tailbuds. Scale bars, 200 μm.
Reprinted from Developmental Biology, 214(1), Miller-Bertoglio, V., Carmany-Rampey, A., Fürthauer, M., Gonzalez, E.M., Thisse, C., Thisse, B., Halpern, M.E., and Solnica-Krezel, L., Maternal and zygotic activity of the zebrafish ogon locus antagonizes BMP signaling, 72-86, Copyright (1999) with permission from Elsevier. Full text @ Dev. Biol.