
- Title
-
Cingulin b Is Required for Zebrafish Lateral Line Development Through Regulation of Mitogen-Activated Protein Kinase and Cellular Senescence Signaling Pathways
- Authors
- Lu, Y., Tang, D., Zheng, Z., Wang, X., Zuo, N., Yan, R., Wu, C., Ma, J., Wang, C., Xu, H., He, Y., Liu, D., Liu, S.
- Source
- Full text @ Front. Mol. Neurosci.
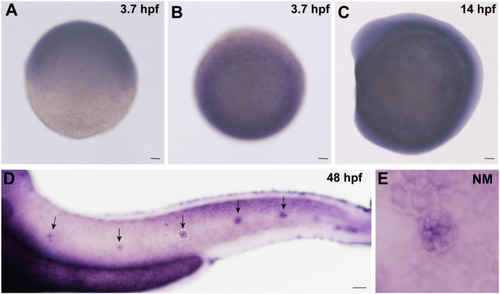
Expression of |
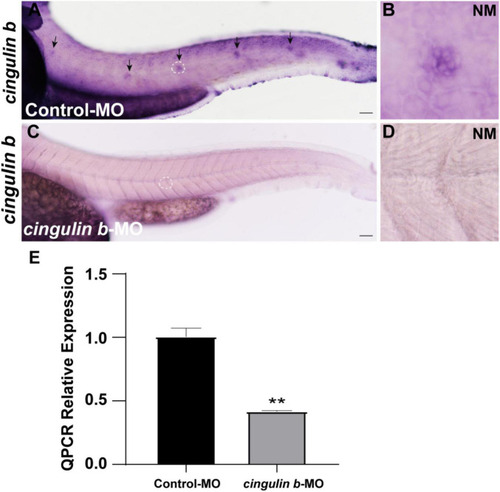
The efficacy of |
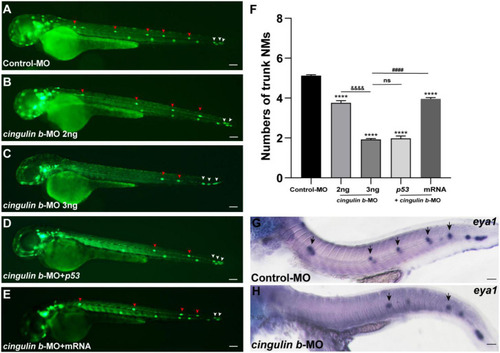
Inhibition of |
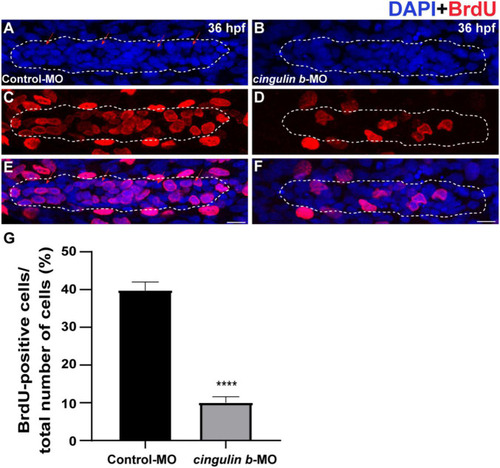
The proliferative cells in the PLL primordium are severely decreased while downregulation of PHENOTYPE:
|
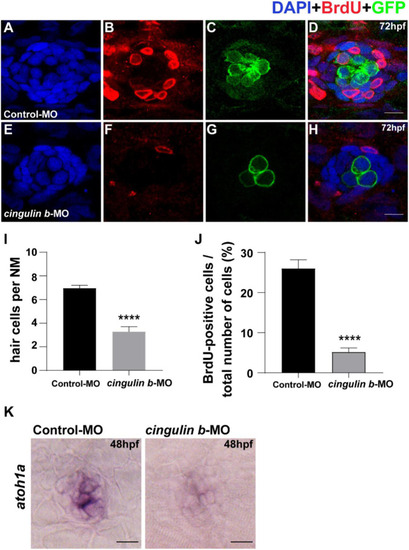
Knockdown of EXPRESSION / LABELING:
PHENOTYPE:
|
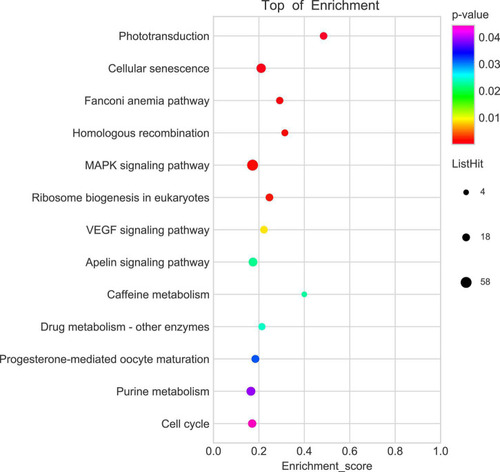
KEGG enrichment analysis screens out top 13 pathways which are highly differentiated expressed between controls and |
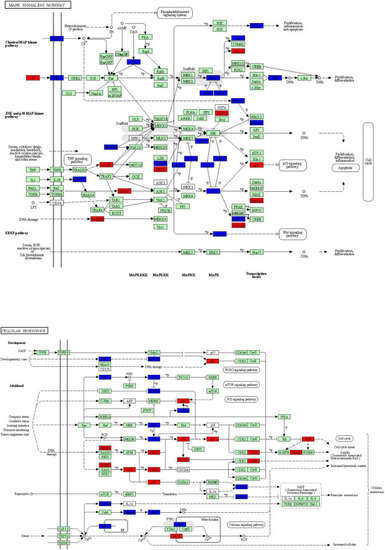
The key KEGG pathways: MAPK signaling pathway and cellular senescence signaling pathway. The red nodes represent upregulated DEGs in |
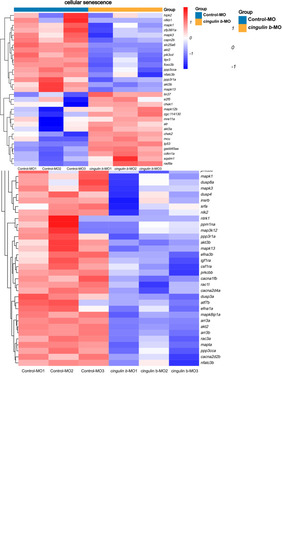
Heatmap analysis of MAPK signaling pathway and cellular senescence signaling pathway in comparison between Control-MO embryos and |
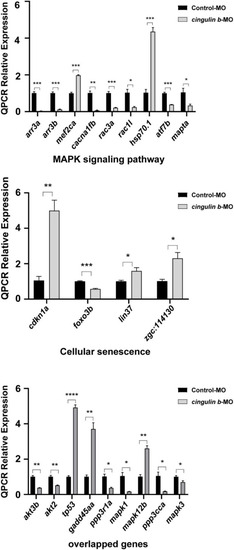
The relative mRNA levels of the indicated genes from MAPK and cellular senescence signaling pathways were normalized to the GAPDH level as determined by qRT-PCR. The results are recorded as mean ± SEM from three independent experiments ( |