
IMAGE
FIGURE 9
Image
|
Figure Caption
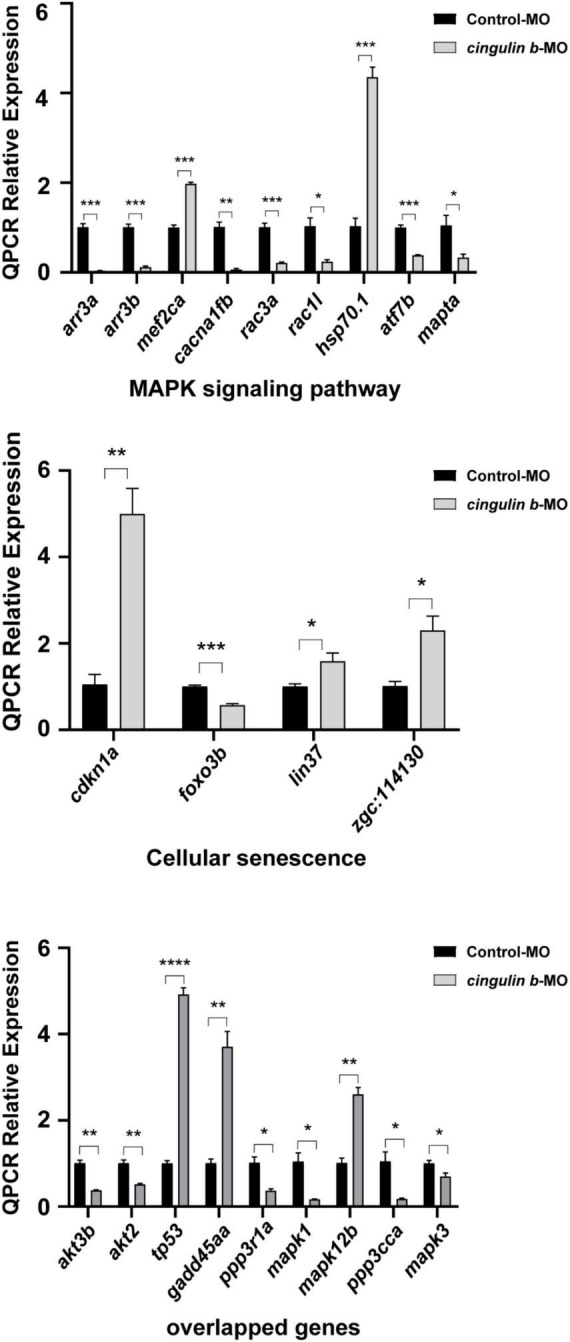
FIGURE 9
The relative mRNA levels of the indicated genes from MAPK and cellular senescence signaling pathways were normalized to the GAPDH level as determined by qRT-PCR. The results are recorded as mean ± SEM from three independent experiments (
Figure Data
Acknowledgments
This image is the copyrighted work of the attributed author or publisher, and
ZFIN has permission only to display this image to its users.
Additional permissions should be obtained from the applicable author or publisher of the image.
Full text @ Front. Mol. Neurosci.