
Image
|
Figure Caption
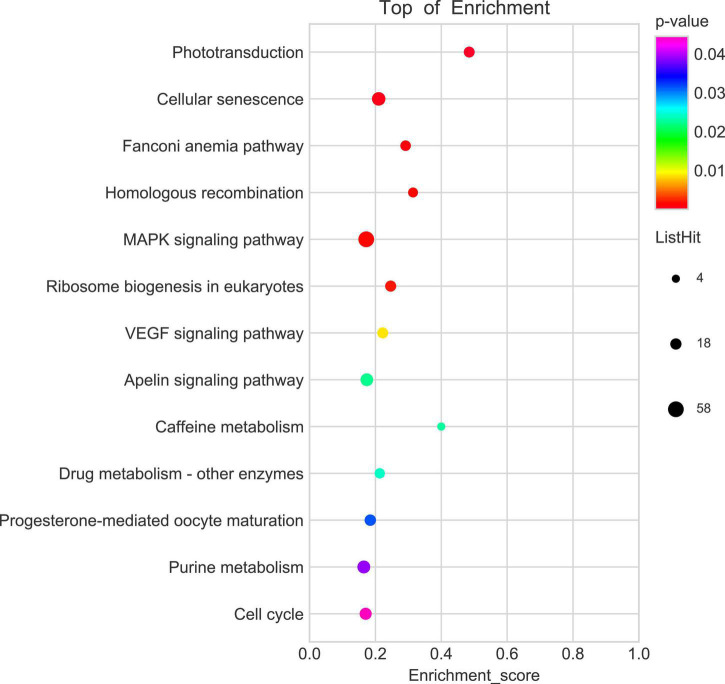
FIGURE 6
KEGG enrichment analysis screens out top 13 pathways which are highly differentiated expressed between controls and
Acknowledgments
This image is the copyrighted work of the attributed author or publisher, and
ZFIN has permission only to display this image to its users.
Additional permissions should be obtained from the applicable author or publisher of the image.
Full text @ Front. Mol. Neurosci.