- Title
-
Generation of a Novel Transgenic Zebrafish for Studying Adipocyte Development and Metabolic Control
- Authors
- Mao, Y., Hong, K.H., Liao, W., Li, L., Kim, S.J., Xiong, Y., Nam, I.K., Choe, S.K., Kwak, S.A.
- Source
- Full text @ Int. J. Mol. Sci.
|
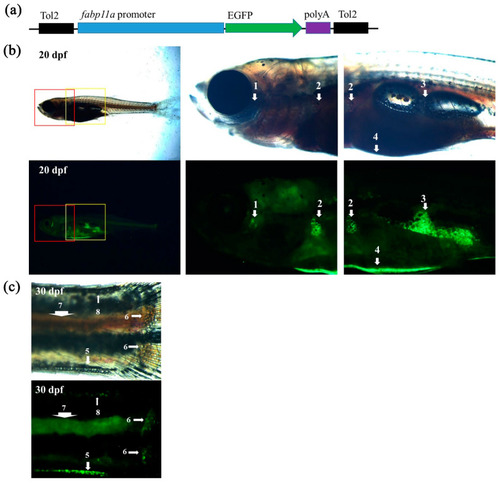
Visualization of adipose tissues in transgenic zebrafish. (a) Schematic drawing of the DNA construct used to generate the zebrafish transgenic line, Tg (fabp11a: EGFP). (b) Overview of a Tg (fabp11a: EGFP) at 20 dpf and zoom-in views of the boxed areas. Numbers denote adipose depots; 1, OCUAT (ocular adipose tissue); 2, PECSAT (pectoral fin subcutaneous adipose tissue); 3, VAT (visceral adipose tissue); and 4, ASAT (abdominal subcutaneous adipose tissue). (c) Imaging of a Tg (fabp11a: EGFP) zebrafish tail at 30 dpf. 5, VSAT (ventral subcutaneous adipose tissue); 6, CFRSAT (caudal fin ray subcutaneous adipose tissue); 7, POSAT (paraosseal adipose tissue); and 8, DSAT (dorsal subcutaneous adipose tissue). |
|
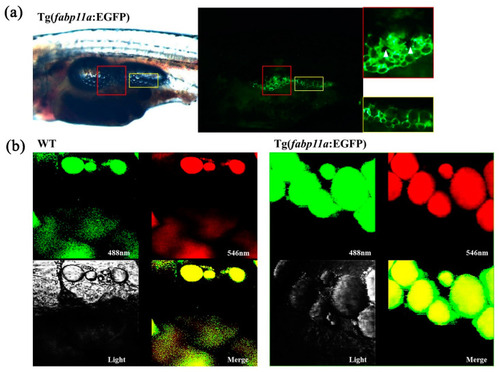
Visualization of adipocyte morphology in the transgenic zebrafish. (a) Images of trunk regions of zebrafish at 18 dpf and zoom-in views of the boxed areas. Red colored boxes show an area of pancreatic adipose tissue with multilayered adipocytes. Yellow colored boxes show an area of adipose tissue with single layer of adipocytes. White arrowheads indicate pigment cells. (b) Confocal images of adipocytes after Nile Red staining which is shown in both green and red. Green fluorescent signals are from both EGFP in the cytoplasm and Nile Red-stained lipid droplet, whereas red fluorescent signal is only from lipid droplet. Merged images show yellow lipid droplet and green cytoplasm. |
|
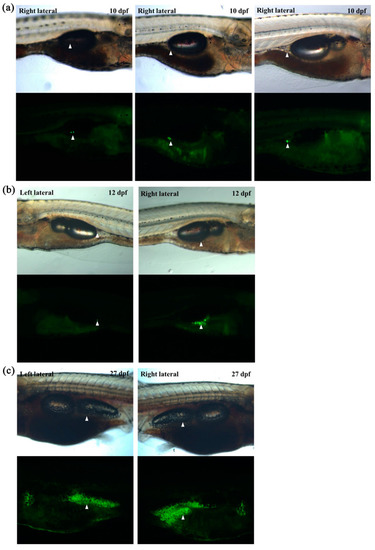
In vivo monitoring of visceral adipose tissue development in larvae using transgenic zebrafish. (a) Representative images of the first adipocyte emerging in three independent larvae at 10 dpf. (b) Representative images of visceral adipose tissues at 12 dpf. The first adipocyte of left lateral emerged. (c) Representative images of visceral adipose tissues at 27 dpf. White arrowheads indicate visceral adipose tissue. |
|
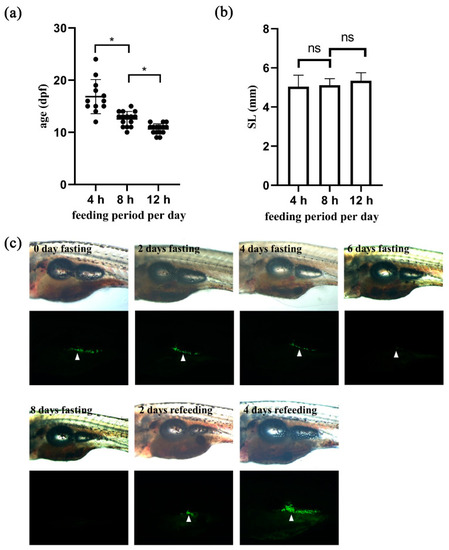
Nutrition influences on adipocyte development and maintenance. (a,b). Zebrafish embryos at 5 dpf were fed for different durations per day as indicated, and adipocyte development was examined. n ≥ 12. Repeat = 3. * indicates p < 0.05, and ns indicates p > 0.05. (a) Graphical presentation of the age of larvae that developed the first adipocyte in three groups. (b) Graphical presentation of the body length of larvae that developed the first adipocyte in three groups. ns, not significant. (c) 16 dpf larvae were selected and subjected to fasting for 8 days, and then refed for another 4 days. Representative bright field and fluorescent images are shown to orient the larvae with visceral adipose tissues marked by white arrowheads. n ≥ 5. Repeat = 3. |


