
|
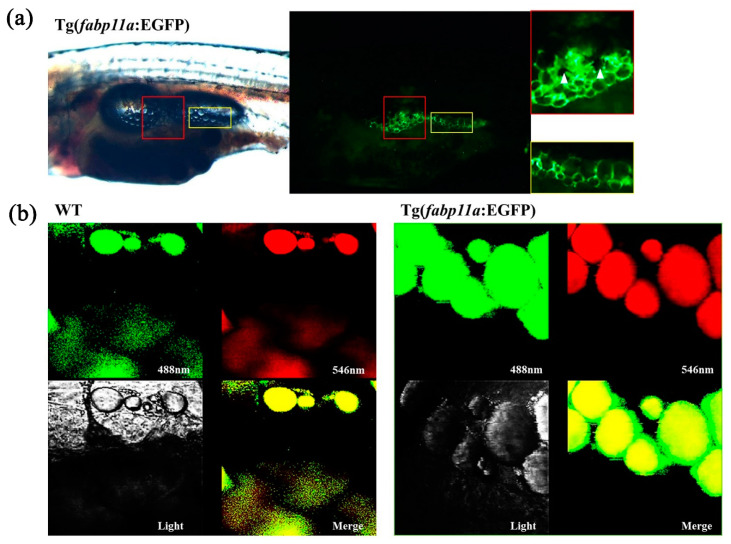
Figure 2 Visualization of adipocyte morphology in the transgenic zebrafish. (a) Images of trunk regions of zebrafish at 18 dpf and zoom-in views of the boxed areas. Red colored boxes show an area of pancreatic adipose tissue with multilayered adipocytes. Yellow colored boxes show an area of adipose tissue with single layer of adipocytes. White arrowheads indicate pigment cells. (b) Confocal images of adipocytes after Nile Red staining which is shown in both green and red. Green fluorescent signals are from both EGFP in the cytoplasm and Nile Red-stained lipid droplet, whereas red fluorescent signal is only from lipid droplet. Merged images show yellow lipid droplet and green cytoplasm.