
|
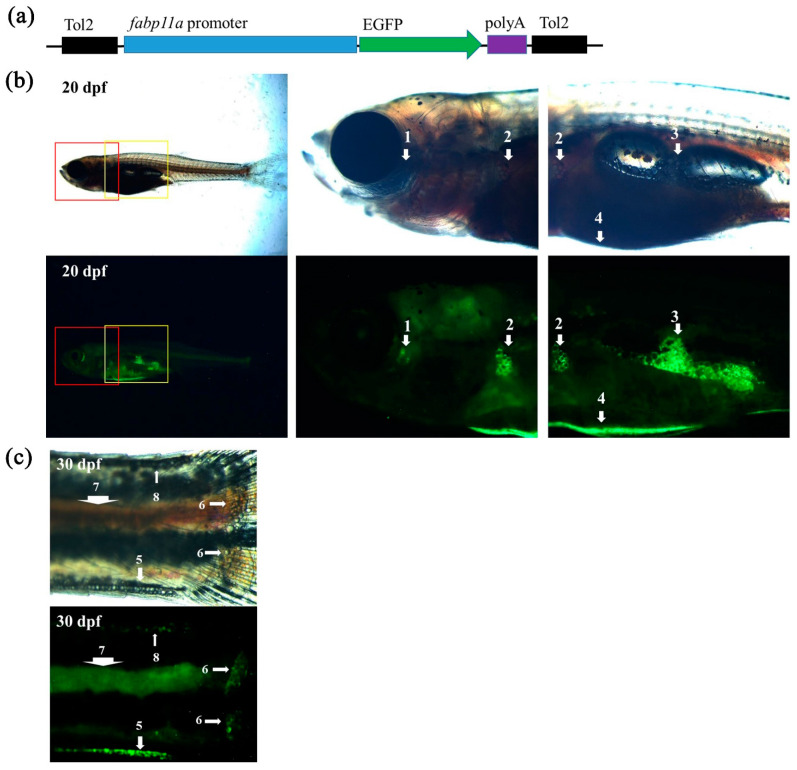
Figure 1 Visualization of adipose tissues in transgenic zebrafish. (a) Schematic drawing of the DNA construct used to generate the zebrafish transgenic line, Tg (fabp11a: EGFP). (b) Overview of a Tg (fabp11a: EGFP) at 20 dpf and zoom-in views of the boxed areas. Numbers denote adipose depots; 1, OCUAT (ocular adipose tissue); 2, PECSAT (pectoral fin subcutaneous adipose tissue); 3, VAT (visceral adipose tissue); and 4, ASAT (abdominal subcutaneous adipose tissue). (c) Imaging of a Tg (fabp11a: EGFP) zebrafish tail at 30 dpf. 5, VSAT (ventral subcutaneous adipose tissue); 6, CFRSAT (caudal fin ray subcutaneous adipose tissue); 7, POSAT (paraosseal adipose tissue); and 8, DSAT (dorsal subcutaneous adipose tissue).