
- Title
-
Knockout of zebrafish desmin genes does not cause skeletal muscle degeneration but alters calcium flux
- Authors
- Kayman Kürekçi, G., Kural Mangit, E., Koyunlar, C., Unsal, S., Saglam, B., Ergin, B., Gizer, M., Uyanik, I., Boustanabadimaralan Düz, N., Korkusuz, P., Talim, B., Purali, N., Hughes, S.M., Dincer, P.R.
- Source
- Full text @ Sci. Rep.

ZFIN is incorporating published figure images and captions as part of an ongoing project. Figures from some publications have not yet been curated, or are not available for display because of copyright restrictions. |
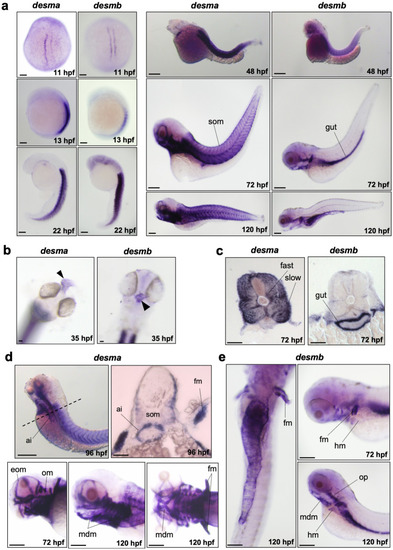
Whole mount in situ mRNA hybridisation of embryos at the indicated stages for antisense probes to EXPRESSION / LABELING:
|
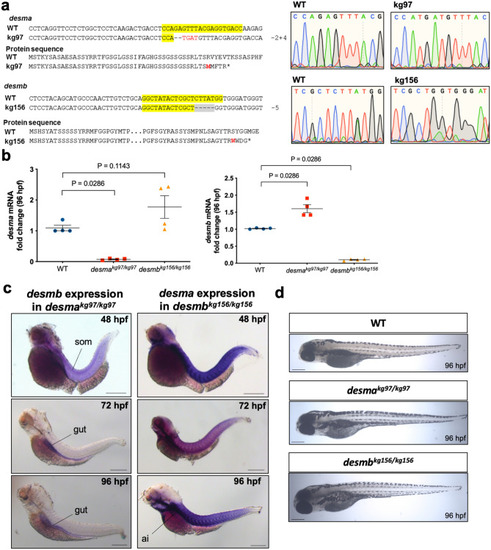
Generation of |
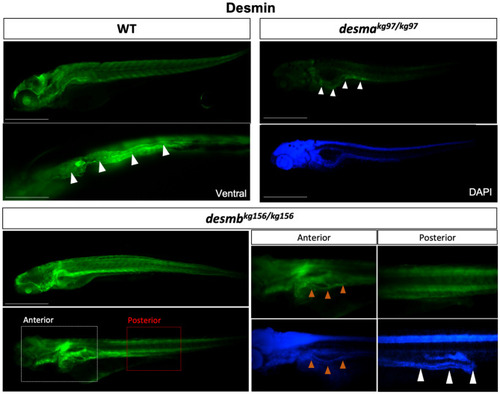
Desmin protein expression in 96 hpf embryos. Whole mount immunofluorescence staining of desmin with anti-desmin polyclonal antibody recognizing both Desma and Desmb, in wild-type and mutant 96 hpf embryos. Left upper panel is lateral view of a WT embryo with anterior to left, dorsal to top, beneath is ventral view with anterior to left, white arrowheads indicate the gut. Right upper panels are lateral views of |
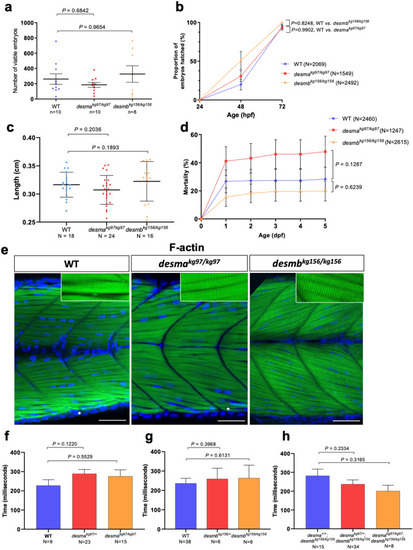
Evaluation of neuromuscular defect in mutant larvae. (a) The number of viable embryos after successful mating of WT fish (n = 10) compared to homozygous desmakg97 (n = 10) (P = 0.6842, Mann–Whitney U) or homozygous desmbkg156 (n = 8) (P = 0.9654, Mann–Whitney U) fish. (b) Comparison of hatching rate between homozygous mutants and WT 24, 48 and 72 hpf embryos At 72 hpf, no significant difference in the hatching rate was found between mutants and WT (desmakg97/kg97 vs. WT, P = 0.9902; desmbkg156/kg156 vs WT, P = 0.3186, repeated measures two-way ANOVA, Bonferroni post hoc test) (c) Body length of 96 hpf WT (N = 18) and homozygous desmakg97 (N = 25) or homozygous desmbkg156 (N = 16) mutant embryos (P = 0.2036 for WT vs. desmakg97/kg97; P = 0.1893 for WT vs. desmbkg156/kg156, Mann–Whitney U). (d) Cumulative mortality rate from 1 to 5 dpf homozygous desmakg97 mutants (N = 1247) compared to WT (N = 2460) (P = 0.1287, repeated measures two-way ANOVA, Bonferroni post hoc test) and homozygous desmbkg156 mutants (N = 2615) compared to WT (P = 0.6239, repeated measures two-way ANOVA, Bonferroni post hoc test). (e) Optical sections of the mid-trunk region of WT and homozygous mutants 96 hpf embryos (N = 8) stained with rhodamine phalloidin (F-actin) with insets showing striations (asterisks indicate occasional wavy fibres in both WT and mutants). Scale bar: 50 µm. (f–h) Touch-evoked escape time (ms) of 48 hpf embryos. Motility experiments were performed blind on siblings from (f) desmakg97/+, (g) desmbkg156/+ or (h) desmakg97/+;desmbkg156/kg156 in-crosses followed by post hoc genotyping. (f) Heterozygous desmakg97 embryos (N = 23) were compared to WT (N = 9) (P = 0.122, Mann–Whitney U) and desmakg97/kg97 (N = 15) compared to WT (P = 0.5529, Mann–Whitney U). (g) Heterozygous desmbkg156 embryos (N = 6) were compared to WT (N = 38) (P = 0.3968, Mann–Whitney U) and desmbkg156/kg156 (N = 6) compared to WT (P = 0.6131, Mann–Whitney U). (h) Homozygous double mutants (N = 8) were compared to desma+/+;desmbkg156/kg156 (n = 15) (P = 0.3165, Mann–Whitney U) and desmakg97/+;desmbkg156/kg156 embryos (n = 34) compared to desma+/+;desmbkg156/kg156 (P = 0.2334, Mann–Whitney U). |
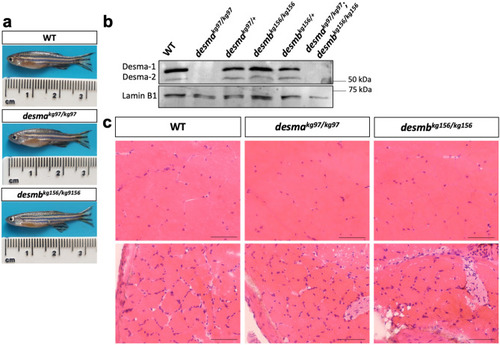
Desmin protein expression and histological examination of adult skeletal muscle. ( |
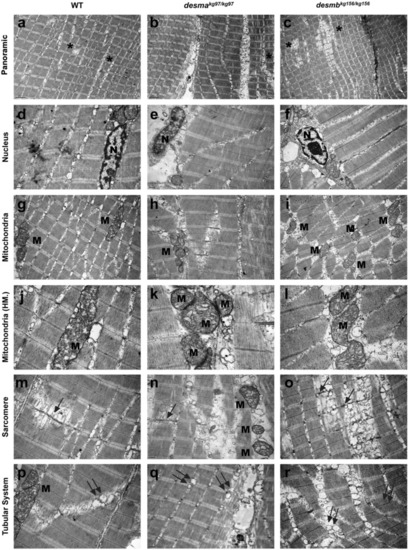
Ultrastructural features of adult WT and mutant skeletal muscle tissue. First, second and third columns present adult WT, PHENOTYPE:
|
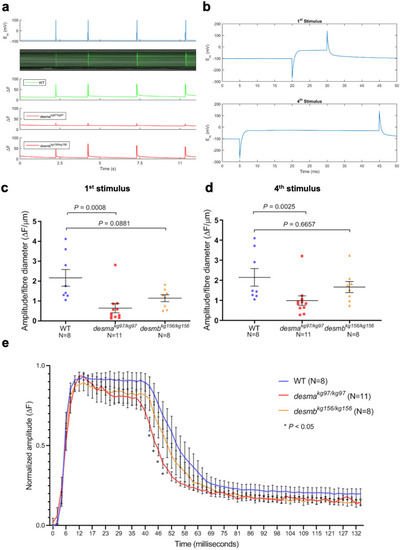
Calcium flux in isolated fibres. ( PHENOTYPE:
|