IMAGE

Figure 7

ID
ZDB-IMAGE-210409-12
Source
Figures for Kayman Kürekçi et al., 2021
Image
Figure Caption

Figure 7

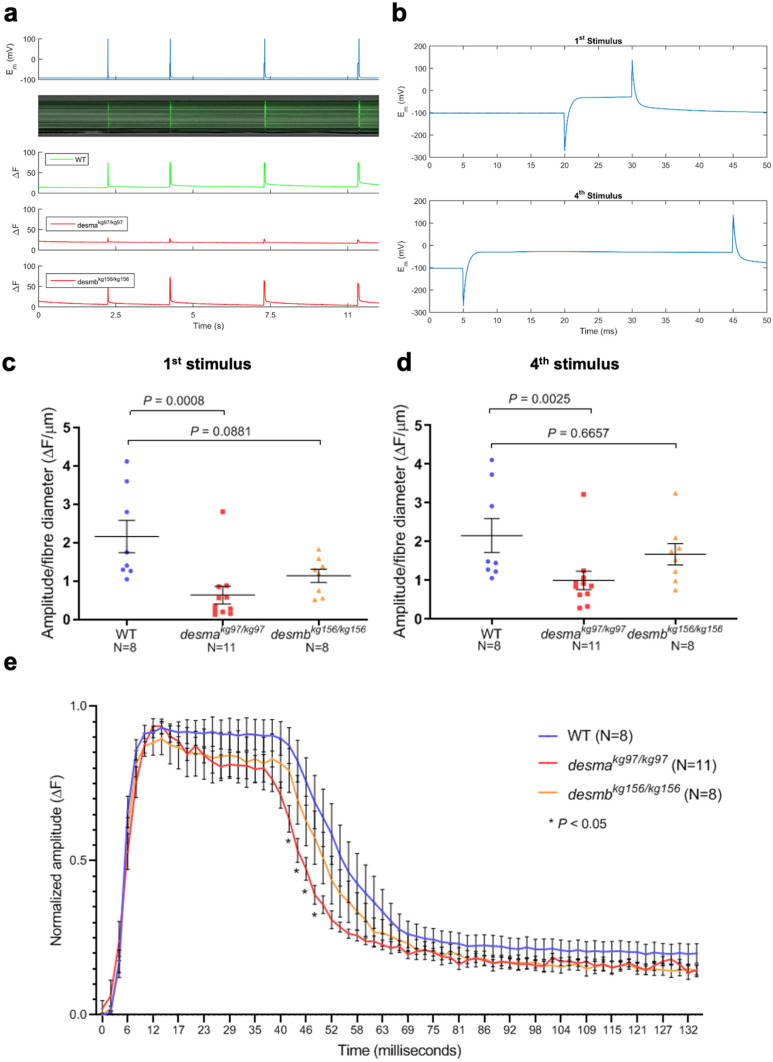
Calcium flux in isolated fibres. (a) Calcium flux along fibres was monitored in vivo by Fluo-4 AM after four consecutive depolarizing stimuli. Top panel, membrane potential responses to current stimulus pulses with varying durations of 10, 20, 30, 40 ms with the amplitude of the current pulse kept constant at 100 mV and the duration increased by 10 ms at each pulse. Middle panel, evoked calcium transients in line scan mode (tx) to current stimuli. Bottom panel, integrated emission signal as a function of time for each experimental group. (b) Membrane potential response to the first stimulus of 10 ms (top) or to the fourth stimulus of 40 ms. (c, d) Baseline corrected amplitude divided by fibre diameter (ΔF/µm) of the calcium emission signals during the first (10 ms) stimulus and fourth (40 ms) stimulus were compared between mutants and WT. (e) Time course analysis of the baseline corrected and normalized amplitude of the calcium transient from the longest stimulus (40 ms) was represented as mean amplitude values as a function of time. Homozygous desmakg97 fibres (N = 11, red curve) or homozygous desmbkg156 fibres (N = 8, orange curve) were compared to WT (N = 8, blue curve). (* indicates time points where P < 0.05, repeated measures two-way ANOVA, Bonferroni post hoc test).

Figure Data
Acknowledgments
This image is the copyrighted work of the attributed author or publisher, and ZFIN has permission only to display this image to its users. Additional permissions should be obtained from the applicable author or publisher of the image. Full text @ Sci. Rep.