FIGURE SUMMARY
Title

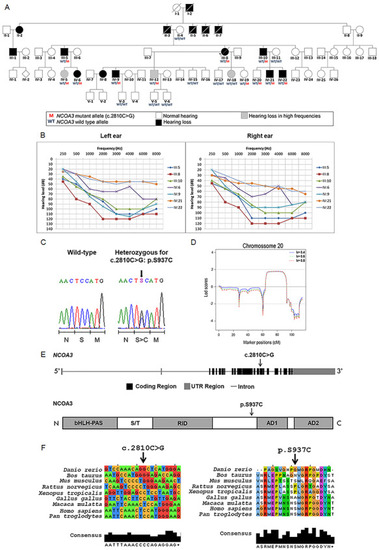
NCOA3 identified as a new candidate to explain autosomal dominant progressive hearing loss

Authors
da Silva, R.S., Dantas, V.L.G., Alves, L.U., Batissoco, A.C., Oiticica, J., Lawrence, E.A., Kawafi, A., Yang, Y., Nicastro, F.S., Novaes, B.C., Hammond, C., Kague, E., Netto, R.C.M.
Source
Full text @ Hum. Mol. Genet.

ZFIN is incorporating published figure images and captions as part of an ongoing project. Figures from some publications have not yet been curated, or are not available for display because of copyright restrictions.

ZFIN is incorporating published figure images and captions as part of an ongoing project. Figures from some publications have not yet been curated, or are not available for display because of copyright restrictions.

A rare variant in NCOA3, a gene which codes a nuclear receptor coactivator, segregates with hearing loss in the family. A) Pedigree showing the segregation of the NCOA3 variant (NM_181659: c.2810C > G: p.Ser937Cys). B) 14 audiometric profiles (divided in right and left ear) of 7 patients affected with sensorineural and bilateral hearing loss. Hearing thresholds until 20 dB are considered normal. C) Chromatograms showing partial sequence from affected patient compared to a wild-type sequence. Arrow indicates position of the NCOA3 variant, while scale bar below indicates which amino acid is changed when the variant is present. D) Multipoint LOD scores calculated with Merlin software for chromosome 20, using data from SNP arrays, under assumption of penetrance K = 0.4, K = 0.6 and K = 0.8. E) Schematics of NCOA3 gene and its respective protein. bHLH = basic helix–loop–helix domain; PAS = Per/ARNT/Sim homologous domain; S/T = serine/threonine-rich region; RID = receptor interaction domain containing multiple LXXLL motifs; AD1 and AD2 = activation domains 1 and 2. F) Multiple alignment of NCOA3 gene and its orthologous (left), as well as multiple alignment of the respective proteins (right). Arrow indicates position of NCOA3 variant (NM_181659: c.2810C > G: p.Ser937Cys).

Ncoa3 is expressed in mice ear at P4, P10 and P16. A) RT-PCR shows expression of Ncoa3 and housekeeping genes Actb and B2m for the different stages of mice cochlea development and Organ of Corti. M = 100 bp molecular weight. Note that Ncoa3 is expressed in all stages analysed and in both tissue samples. B) Immunofluorescence on transversal histological sections of mice cochlea. In the bottom right corner, a greater zoom of P14 mice cochlea is displayed, showing expression pattern of NCOA3. Anti-NCOA3 (red) has been used, with nuclei shown in blue (DAPI). BM = Basilar Membrane, OC = Organ of Corti, RM = Reissner Membrane, SG = Spiral Ganglion, SL = Spiral Limbus, SV = Stria Vascularis, TM = Tectorial Membrane. C) Expression of endogenous ncoa3 in zebrafish inner ears at larval stages: 3 dpf and 5dpf (days post-fertilization); and juvenile stages: 5wpf and 7wpf (weeks-post-fertilization). OV= Otic Vesicle, IE= Inner Ear. Scale bars = 200 μm for 3 and 5 dpf, and 500 μm for 5 and 7wpf.

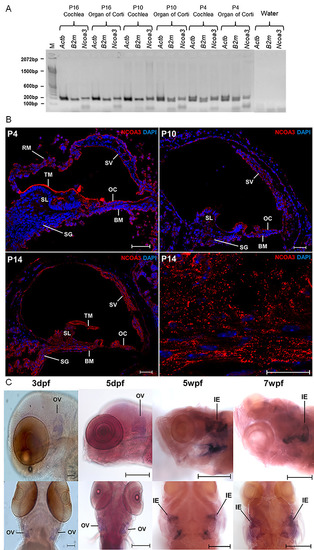
EXPRESSION / LABELING:
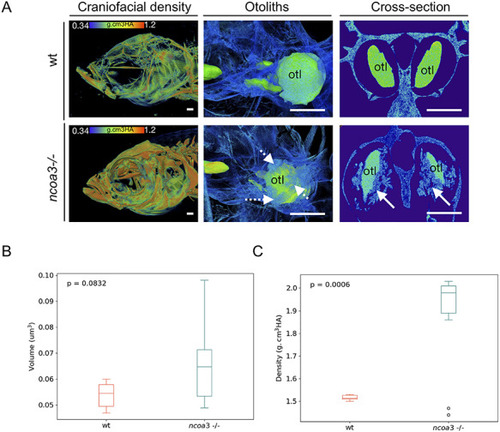
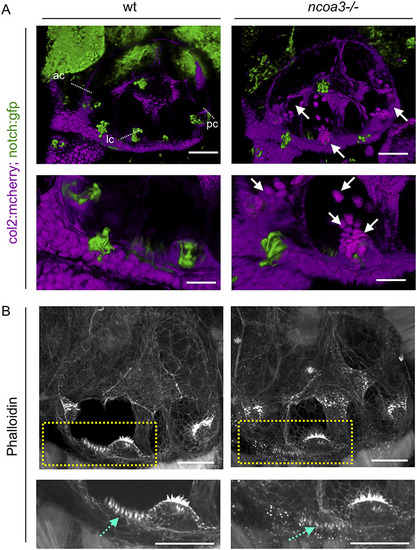
Gene:
Fish:
Anatomical Terms:
Stage Range: Protruding-mouth to Days 45-89

Abnormal cartilage behaviour and macula hair distribution in ears of ncoa3−/− A) 3D renders from confocal images of wt and ncoa3−/− carrying Tg(col2:mcherry, notch:gfp) to show cartilage and cristae, respectively. Arrows indicate abnormal cartilage cell behaviour (cell exostosis). (ac = anterior crista, lc = lateral crista, pc = posterior crista). Scale bars = 50 μm. Regions of anterior crista and macula were zoomed in. Scale bars = 20 μm. B) Phalloidin staining and confocal imaging to show the distribution of hair cells. Yellow dashed box to show zoomed in region. Abnormal distribution of hair cells was observed in the macula (dashed cyan arrows). Scale bars = 50 μm, zoomed in region = 20 μm.

Abnormal mineralisation of amorphous material within the adult inner ears and higher BMD in ncoa3−/−. A) 3D renders from μCT images of wt and ncoa3−/− of same age (1 year old). The head was color-coded to show bone mineral density (g.cm3HA; min = 0.338; max = 1.124). Note that craniofacial bones in ncoa3 mutants have higher density compared to wt. Otoliths (otl = arrows) were zoomed in. Abnormal mineralisation (dashed arrows) is observed attached to the otoliths. A cross section picture was taken to show the mineralised amorphous material (arrows) juxtaposed to the otoliths. B) Volume of otoliths. C) Bone mineral density of central region of otoliths. Non-parametric, two-tailed, independent Student’s t-Test was used as statistical analysis (p < 0.05). Scale bars = 500 μm.

Altered swimming behaviour of adult ncoa3 −/− suggests hearing malfunction. A) Overlapped Trajectories of 1-year old wt (n = 7) and ncoa3−/− (n = 6). The bottom right corner is shaded, where the fish are more likely to stay. B) Average spatial distribution of wt and ncoa3−/−. A brighter colour indicates that the fish are more likely to stay in the respective region. For every trajectory acquired from different fish, the corresponding spatial distribution P(N) was calculated. From every P(N), the standard deviation of N in all the grids is calculated, noted as Std(N). C) Graph of Std(N) values for wt and ncoa3−/−. Error bars represent the standard deviation of Std(N). Non-parametric, two tailed, t-Test was used (p = 0.06).

Acknowledgments
This image is the copyrighted work of the attributed author or publisher, and ZFIN has permission only to display this image to its users. Additional permissions should be obtained from the applicable author or publisher of the image. Full text @ Hum. Mol. Genet.