|
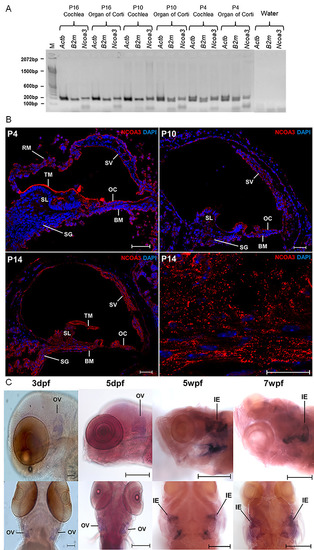
Ncoa3 is expressed in mice ear at P4, P10 and P16. A) RT-PCR shows expression of Ncoa3 and housekeeping genes Actb and B2m for the different stages of mice cochlea development and Organ of Corti. M = 100 bp molecular weight. Note that Ncoa3 is expressed in all stages analysed and in both tissue samples. B) Immunofluorescence on transversal histological sections of mice cochlea. In the bottom right corner, a greater zoom of P14 mice cochlea is displayed, showing expression pattern of NCOA3. Anti-NCOA3 (red) has been used, with nuclei shown in blue (DAPI). BM = Basilar Membrane, OC = Organ of Corti, RM = Reissner Membrane, SG = Spiral Ganglion, SL = Spiral Limbus, SV = Stria Vascularis, TM = Tectorial Membrane. C) Expression of endogenous ncoa3 in zebrafish inner ears at larval stages: 3 dpf and 5dpf (days post-fertilization); and juvenile stages: 5wpf and 7wpf (weeks-post-fertilization). OV= Otic Vesicle, IE= Inner Ear. Scale bars = 200 μm for 3 and 5 dpf, and 500 μm for 5 and 7wpf.
|