
- Title
-
Use of a carbonic anhydrase ca17a knockout to investigate mechanisms of ion uptake in zebrafish (Danio rerio)
- Authors
- Zimmer, A.M., Mandic, M., Yew, H.M., Kunert, E., Pan, Y.K., Ha, J., Kwong, R.W.M., Gilmour, K.M., Perry, S.F.
- Source
- Full text @ Am. J. Physiol. Regul. Integr. Comp. Physiol.
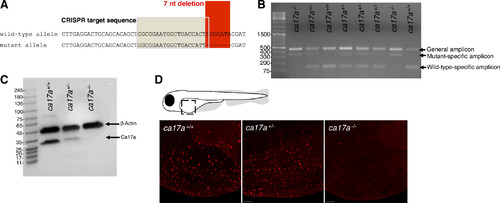
Genotyping and confirmation of ca17a−/− deletion in larval zebrafish (Danio rerio). A: nucleotide alignment of the sequenced ca17a+/+ and ca17a−/− alleles showing the CRISPR sgRNA target sequence in the shaded box and the positions of the 7 nucleotide (nt) deletion and C to T substitution mutations in the red box. B: multiplex PCR products from fin clips of F2 larval offspring of F1 ca17a+/− crosses. The general amplicon (477 base pairs; bp) band appears for all genotypes, the 147-bp band is the ca17a+/+-specific amplicon, and the 352-bp band is the ca17a−/−-specific amplicon. C: representative Western blot of Ca17a and β-actin protein expression in ca17a+/+, ca17a+/−, and ca17a−/− whole larvae homogenates at 9 days postfertilization (dpf). D: immunofluorescent staining of Ca17a in the yolk sac of ca17a+/+, ca17a+/−, and ca17a−/− 4 dpf larval zebrafish. Scale bar = 50 μm. |
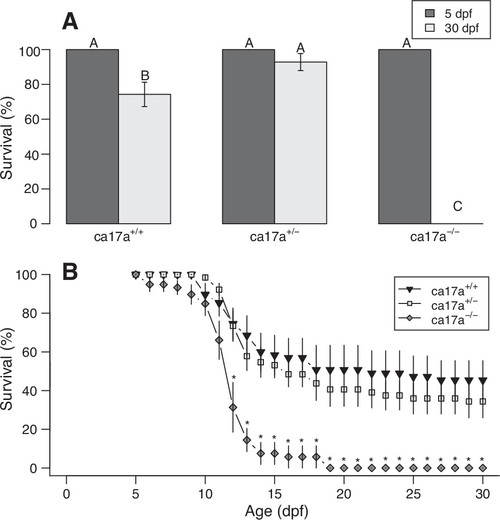
Survival of ca17a+/+, ca17a+/−, and ca17a−/− zebrafish (Danio rerio) larvae over development. A: percent survival of larvae at 5 and 30 dpf under flow-through conditions. B: survival curves of larvae from 5 to 30 dpf under static conditions. There was a significant interaction of genotype and age on survival in A (two-way RM ANOVA; genotype × age, F = 57.6, P < 0.01; genotype, F = 57.6, P < 0.01; age, F = 2.0, P = 0.19; n = 5 tanks for ca17a+/+, n = 6 tanks for ca17a+/−, and n = 3 tanks for ca17a−/−). Bars with different letters are significantly different (P < 0.05) from one another. Survival curves in B were analyzed using Markov chain Monte Carlo sampler for multivariate generalized linear models (n = 8 tanks for ca17a+/+ and ca17a−/−, n = 7 tanks for ca17a+/−). *Significant difference from the wild-type ca17a+/+. Data are presented as means ± SE. dpf, days postfertilization. PHENOTYPE:
|
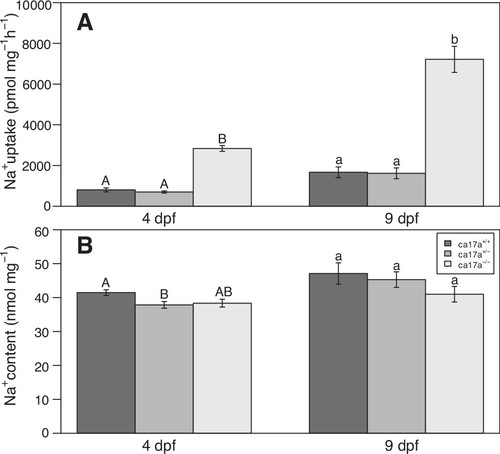
Na+ uptake rates and whole body Na+ content of ca17a+/+, ca17a+/−, and ca17a−/− zebrafish (Danio rerio) larvae over development. There was a significant effect of genotype on Na+ uptake (A) (ANOVA; 4 dpf: F = 133, P < 0.01, n = 8; 9 dpf: F = 60.6, P < 0.01, n = 8 for ca17a+/+ and ca17a+/−, n = 7 for ca17a−/−) and on Na+ content in 4 dpf (B) (ANOVA; F = 4.2, P = 0.03, n = 7 for ca17a+/+ and ca17a+/−, n = 6 for ca17a−/−) but not 9 dpf (ANOVA; F = 1.0, P = 0.35, n = 8 for ca17a+/+ and ca17a+/−, n = 5 for ca17a−/−) larvae. Bars with different letters are significantly different (P < 0.05) from one another across genotypes in 4-dpf (uppercase letters) and 9-dpf (lowercase letters) larvae. Data are presented as means ± SE. dpf, days postfertilization. |
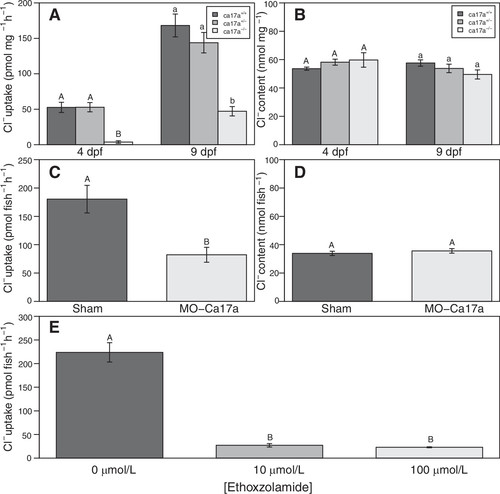
Cl− uptake rates and whole body Cl− content of ca17a+/+, ca17a+/−, and ca17a−/− larvae (A and B), as well as sham Ca17a morpholino-treated larvae (C and D), and the effect of ethoxzolamide on Cl− uptake (E) in zebrafish (Danio rerio) larvae. There was a significant effect of genotype on Cl− uptake in 4- and 9-dpf larvae (A) (ANOVA; 4 dpf: F = 55.1, P < 0.01, n = 16 for ca17a+/+ and ca17a+/−, n = 12 for ca17a−/−; 9 dpf: F = 21.5, P < 0.01, n = 13 for ca17a+/+, n = 12 for ca17a+/−, n = 11 for ca17a−/−) but not Cl− content in 4 dpf (B) (ANOVA; F = 1.1, P = 0.36, n = 7 for ca17a+/+ and ca17a+/−, n = 6 for ca17a−/−) or 9 dpf (ANOVA; F = 1.9, P = 0.18, n = 8 for ca17a+/+ and ca17a+/−, n = 5 for ca17a−/−) larvae. There was an effect of Ca17a knockdown on Cl− uptake in 4-dpf zebrafish (C) (Welch’s two-sample t test; t = 3.5, P < 0.01, n = 6), but not Cl− content (D) (Welch’s two-sample t test; t = −0.8, P = 0.5, n = 6). There was an effect of ethoxzolamide on Cl− uptake in 4-dpf zebrafish (E) [one-way nonparametric ANOVA (Kruskal–Wallis); χ2 = 12.1, P < 0.01, n = 6]. Values with different letters are significantly different (P < 0.05) from one another. Data are presented as means ± SE. dpf, days postfertilization. |
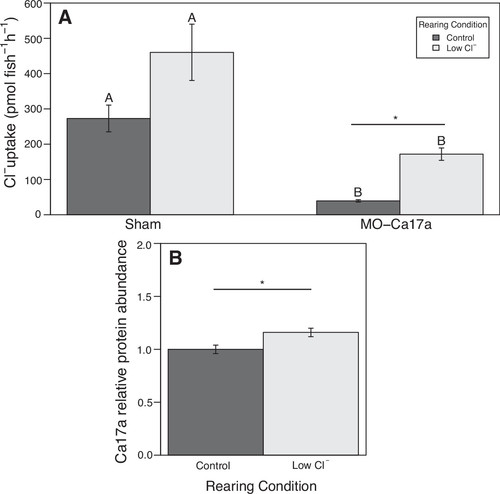
The effect of Ca17a knockdown on chloride (Cl−) uptake in 4-dpf zebrafish (Danio rerio) larvae reared in low-Cl− water and the effect of rearing in low-Cl− water on ca17a protein abundance in 4-dpf larvae. There was an effect of ca17a knockdown and rearing water Cl− concentration on Cl− uptake (A) (two-way ANOVA; Cl− concentration: F = 51.9, P < 0.01, morpholino: F = 110.1, P < 0.01, Cl− concentration × morpholino: F = 13.6, P < 0.01, n = 7). There was an effect of rearing water Cl− concentration on Ca17a protein abundance (B) (Welch’s two-sample t test; t = −2.8, P = 0.02, n = 6). Different letters signify significant (P < 0.05) differences between sham and morpholino larvae within a rearing water Cl− concentration and bars with an asterisk indicate significant effects of rearing water Cl− concentration. Data are presented as means ± SE. |
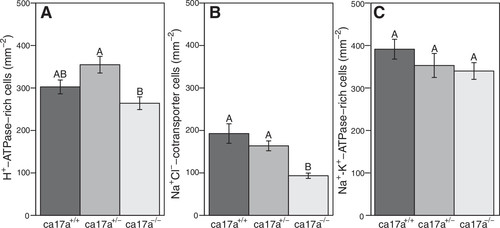
Ionocyte density in ca17a+/+, ca17a+/−, and ca17a−/− zebrafish (Danio rerio) larvae at 4 dpf. Density of H+-ATPase-rich cells (A) and Na+ Cl−-cotransporter cells (B) significantly differed among genotypes (ANOVA; A: F = 7.7, P < 0.01, n = 14 for ca17a+/+, n = 19 for ca17a+/−, and n = 23 for ca17a−/−; B: F = 20.5, P < 0.01, n = 15 for ca17a+/+, n = 16 for ca17a+/−, and n = 26 for ca17a−/−, respectively). There was no effect of genotype on Na+-K+-ATPase-rich cells (C) (ANOVA; F = 1.3, P = 0.29, n = 8 for ca17a+/+ and ca17a+/−, n = 11 for ca17a−/−). Bars with different letters are significantly different (P < 0.05) from one another across genotypes. Data are presented as means ± SE. PHENOTYPE:
|
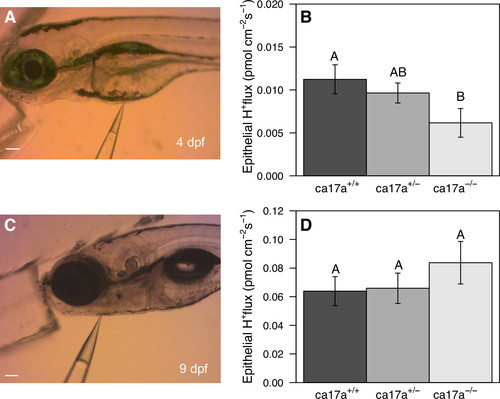
Epithelial H+ flux in ca17a+/+, ca17a+/−, and ca17a−/− zebrafish (Danio rerio) larvae. The H+ flux was measured in the ventral yolk sac area of 4-dpf larvae (A) and the pharyngeal arch area of 9-dpf larvae (C). Scale bars = 100 μm. There was an effect of genotype on H+ flux at the yolk sac of 4 dpf larvae (B) (ANOVA; F = 4.7, P = 0.02, n = 7 for ca17a+/+ and ca17a+/−, n = 6 for ca17a−/−) but not H+ flux at the pharyngeal arch region of 9-dpf larvae (D) (ANOVA; F = 0.8, P = 0.45, n = 8 for ca17a+/+ and ca17a+/−, n = 7 for ca17a−/−). Bars with different letters are significantly different (P < 0.05) from one another. Data are presented as means ± SE. dpf, days postfertilization. |
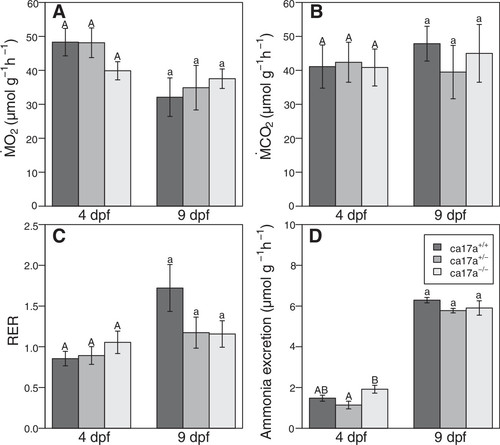
Gas transfer, respiratory exchange ratio (RER; /Ṁo2) and ammonia excretion in ca17a+/+, ca17a+/−, and ca17a−/− zebrafish (Danio rerio) larvae at 4 dpf and 9 dpf. There was no effect of genotype on O2 consumption (A) (Ṁo2; ANOVA; 4 dpf: F = 1.7, P = 0.19; 9 dpf: F = 0.7, P = 0.49), CO2 excretion (B) (Ṁco2; ANOVA; 4 dpf: F<0.1, P = 0.99; 9 dpf: F = 0.3, P = 0.72), or RER (C) (ANOVA; 4 dpf: F = 0.9, P = 0.42; 9 dpf: F = 2.1, P = 0.15) in 4 and 9 dpf larvae (4 dpf: n = 12 for ca17a+/+ and ca17a−/−, n = 10 for ca17a+/−; 9 dpf: n = 8 for ca17a+/+ and ca17a−/−, n = 7 for ca17a+/−). There was an effect of genotype on ammonia excretion in 4-dpf (D) (ANOVA; F = 6.1, P < 0.01, n = 9 for ca17a+/+ and ca17a+/−, n = 8 for ca17a−/−) but not 9-dpf larvae (ANOVA; F = 3.1, P = 0.07, n = 9 for ca17a+/+ and ca17a+/−, n = 6 for ca17a−/−). Bars with different letters are significantly different (P < 0.05) from one another across genotypes. Data are presented as means ± SE. dpf, days postfertilization. |