
|
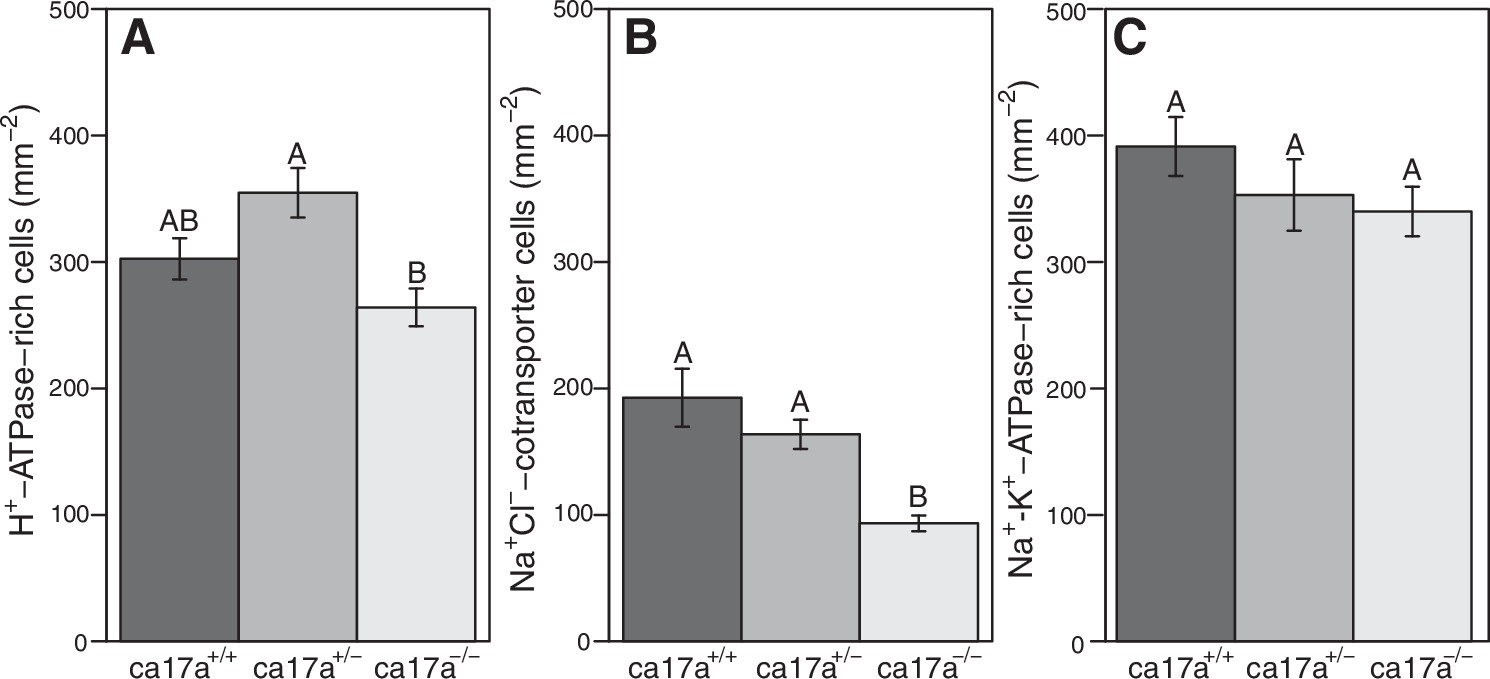
Fig. 6 Ionocyte density in ca17a+/+, ca17a+/−, and ca17a−/− zebrafish (Danio rerio) larvae at 4 dpf. Density of H+-ATPase-rich cells (A) and Na+ Cl−-cotransporter cells (B) significantly differed among genotypes (ANOVA; A: F = 7.7, P < 0.01, n = 14 for ca17a+/+, n = 19 for ca17a+/−, and n = 23 for ca17a−/−; B: F = 20.5, P < 0.01, n = 15 for ca17a+/+, n = 16 for ca17a+/−, and n = 26 for ca17a−/−, respectively). There was no effect of genotype on Na+-K+-ATPase-rich cells (C) (ANOVA; F = 1.3, P = 0.29, n = 8 for ca17a+/+ and ca17a+/−, n = 11 for ca17a−/−). Bars with different letters are significantly different (P < 0.05) from one another across genotypes. Data are presented as means ± SE.