
|
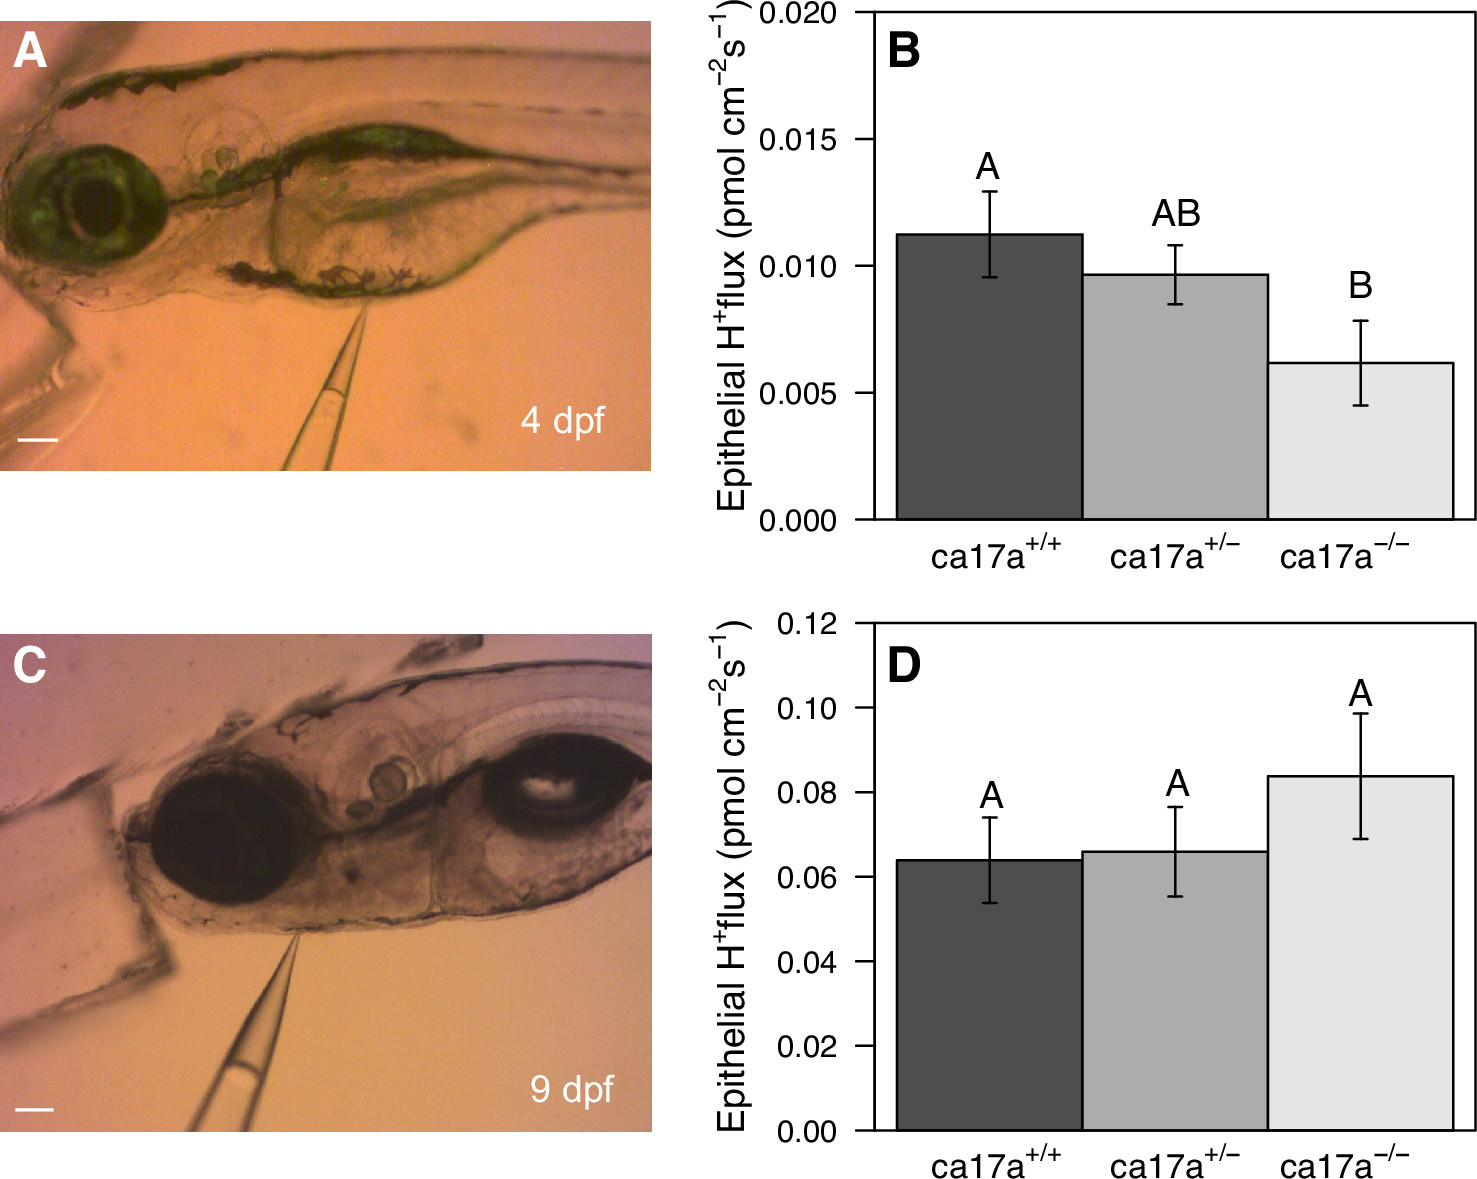
Fig. 7 Epithelial H+ flux in ca17a+/+, ca17a+/−, and ca17a−/− zebrafish (Danio rerio) larvae. The H+ flux was measured in the ventral yolk sac area of 4-dpf larvae (A) and the pharyngeal arch area of 9-dpf larvae (C). Scale bars = 100 μm. There was an effect of genotype on H+ flux at the yolk sac of 4 dpf larvae (B) (ANOVA; F = 4.7, P = 0.02, n = 7 for ca17a+/+ and ca17a+/−, n = 6 for ca17a−/−) but not H+ flux at the pharyngeal arch region of 9-dpf larvae (D) (ANOVA; F = 0.8, P = 0.45, n = 8 for ca17a+/+ and ca17a+/−, n = 7 for ca17a−/−). Bars with different letters are significantly different (P < 0.05) from one another. Data are presented as means ± SE. dpf, days postfertilization.