
- Title
-
The zebrafish histamine H3 receptor modulates aggression, neural activity and forebrain functional connectivity
- Authors
- Reichmann, F., Rimmer, N., Tilley, C.A., Dalla Vecchia, E., Pinion, J., Al Oustah, A., Carreño Gutiérrez, H., Young, A.M., McDearmid, J.R., Winter, M.J., Norton, W.H.
- Source
- Full text @ Acta Physiol. (Oxf).
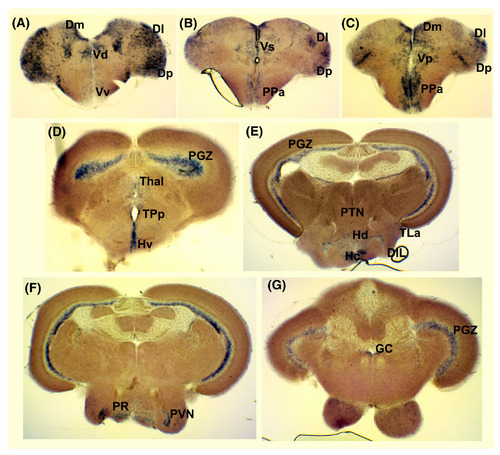
Expression of histamine receptor H3 (hrh3) in the adult zebrafish brain. A‐G, In situ hybridization showing hrh3 gene expression in the medial, lateral and posterior zone of the dorsal telencephalic area (Dm, Dl and Dp), the ventral, dorsal, supra‐ and post‐commissural nuclei of the ventral telencephalic area (Vv, Vd, Vs and Vp), the anterior parvocellular preoptic nucleus (PPa), the ventral, caudal and dorsal zone of the periventricular hypothalamus (Hv, Hc and Hd), the area around the posterior recess of the diencephalic ventricle (PR), torus lateralis (TLa), periventricular nucleus of posterior tuberculum (TPp), posterior tuberal nucleus (PTN), periventricular nucleus of the inferior lobe of the hypothalamus (PVN), diffuse nucleus of the inferior lobe (DIL), the periventricular grey zone of the optic tectum (PGZ), thalamic nuclei including anterior thalamic nucleus, ventromedial and ventrolateral thalamic nucleus and central and dorsal posterior thalamic nucleus (Thal) and the griseum centrale (GC) EXPRESSION / LABELING:
|
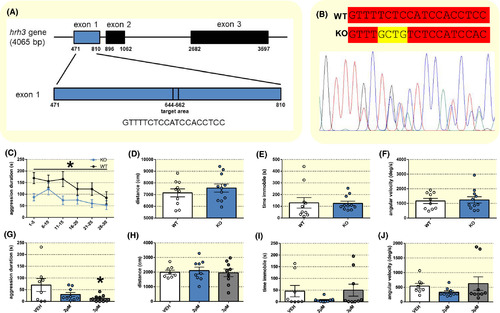
Genetic deletion and inverse agonism of the Histamine receptor H3 (hrh3) reduces aggression. A, Target site for CRISPR‐Cas9 genome editing within the hrh3 gene. Numbers represent bp positions. B, Representative Sanger sequencing chromatogram of an hrh3+/− fish. Wild‐type (WT) and mutant (KO) allele sequences around the mutation site are depicted at the top with a 4 bp insertion in the mutant allele shown in yellow. C, Time spent in aggressive display presented as 5 min time bins, (D) total distance travelled, (E) time spent immobile and (F) angular velocity during a 30 min mirror‐induced aggression (MIA) test. n = 10‐11. Repeated measures ANOVA or Student's t test. *P < .05 hrh3−/− KO vs WT. G, Time spent in aggressive display, (H) total distance travelled, (I) time spent immobile and (J) angular velocity in a 5 min MIA test after 1 h pre‐treatment with pitolisant (2 µmol/L or 3 µmol/L) or vehicle (VEH). n = 8‐9. One‐way ANOVA followed by Tukey's post‐hoc test. *P < .05 vs VEH. Data are presented as mean ± SEM PHENOTYPE:
|
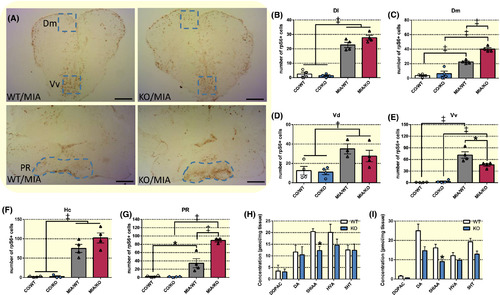
Effects of histamine receptor H3 (hrh3) deletion on neuronal activation and neurotransmitter levels. A, Representative images depicting differences in rpS6 immunoreactivity between aggression‐exposed wild‐type (WT/MIA) and mutant fish (KO/MIA) in the telencephalon and hypothalamus. The selected counting areas are indicated in blue. Scale bar: 150 µm. B‐G, Number of ribosomal protein S6 (rpS6)+ cells in (B) the lateral and (C) medial zone of the dorsal telencephalic area (Dl and Dm), (D) the dorsal and (E) ventral nuclei of the ventral telencephalic area (Vd and Vv), (F) the caudal zone of the periventricular hypothalamus (Hc) and (G) the area around the posterior recess of the diencephalic ventricle (PR) in hrh3−/− (KO) and corresponding wild‐type (WT) fish under basal conditions (CO) and after 1 h aggression exposure (MIA). n = 3‐4. Two‐way ANOVA followed by Tukey's post‐hoc test in case of a significant interaction term. Otherwise significant main effects are indicated in the graph. ‡P < .001, †P < .01, *P < .05 (H and I) HPLC measurements of neurotransmitter and neurotransmitter metabolite levels in (H) the telencephalon and (I) diencephalon. n = 5‐7. Bonferroni‐corrected t tests.*P < .05 vs 5‐HIAA WT levels. Data are presented as mean ± SEM EXPRESSION / LABELING:
PHENOTYPE:
|
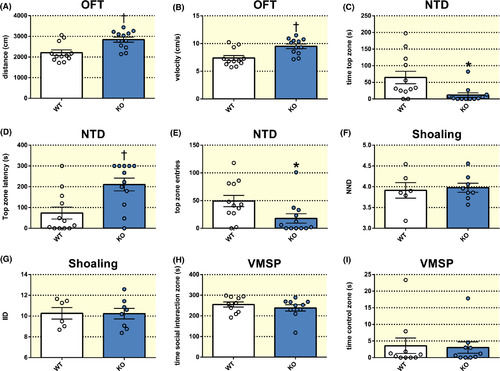
Effects of histamine receptor H3 (hrh3) deletion on locomotor activity, anxiety and social behaviour. A, Total distance travelled and (B) velocity of hrh3−/− (KO) and corresponding wild‐type fish (WT) in the open field test (OFT). n = 12/group. C, Time spent in the top zone, (D) top zone latency and (E) number of top zone entries in the novel tank diving test (NTD). n = 12/group. (F) Nearest neighbour distance (NND) and (G) inter‐individual distance (IID) in shoaling assays. n = 6‐8. H, Time spent in the social interaction zone and (I) the control zone of the visually mediated social preference test (VMSP). n = 10/group. Student's t test or Mann‐Whitney U test. †P < .01, *P < .05 vs WT. Data are presented as mean ± SEM PHENOTYPE:
|
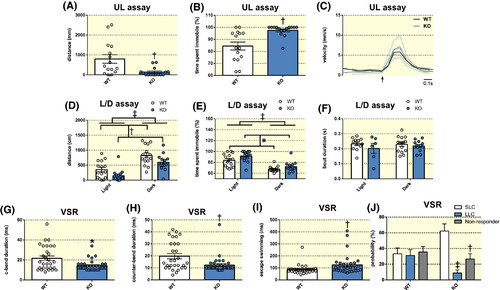
Effects of histamine receptor H3 (hrh3) deletion on larval behaviour. A, Total distance travelled, (B) time spent immobile and (C) average velocity during beat‐glide swimming of larval hrh3−/− (KO) and corresponding wild‐type (WT) fish in the larval unstimulated locomotion (UL) assay. The arrow in (C) indicates the onset of the swimming bout. n = 15/group. Mann‐Whitney U test. †P < .01 vs WT. D, Total distance travelled, (E) time spent immobile and (F) average swim bout duration in the larval light/dark transition (L/D) assay. n = 15/group. Two‐way ANOVA. Significant main effects are indicated in the graph. ‡P < .001, †P < .01, *P < .05. G‐I, Visual startle response (VSR) test. Larval KO fish displayed (G) shorter c‐bend durations, (H) shorter counter‐bend durations and (I) enhanced escape swimming compared to corresponding WT fish. n = 15/group. Mann‐Whitney U test. †P < .01, *P < .05 vs WT (J) In addition, KO fish were more likely to perform short latency c‐bends (SLC) compared to long latency c‐bends (LLC) and not responding at all. n = 15/group. Two‐way ANOVA followed by Tukey's post‐hoc test. ‡P < .001, †P < .01 vs SLC/KO. Data are presented as mean ± SEM PHENOTYPE:
|
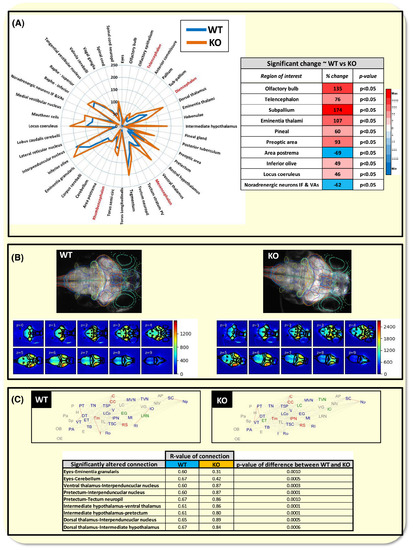
Effects of histamine receptor H3 (hrh3) deletion on whole brain neural activity and functional connectivity between specific brain regions. (a) Left ~ radar plot showing changes in peak fluorescence intensity between wild‐type (WT) and mutants (KO) within each registered brain region. Gross regions shown in red, and subregions in black (abbreviations: IF &VAs = interfascicular and vagal areas; PV = periventriculare). Note changes in activity within specific brain regions some of which were significantly different between WT and KO shown in the table on the right. (Mann‐Whitney or t test, α = 0.05, n = 15). Colour coding in the table shows the degree of increase (red) or decrease (blue) in values from the WT to the KO, with darker shades showing a higher degree of change relative to other regions within that treatment group. (b) Top ~ example WT and KO maximum projections of neural activity overlaid by outlines of the registered regions of interest from which the peak fluorescence intensity values were extracted. The lower images are the corresponding median intensity projections obtained at each Z‐level from these example animals showing which regions exhibited higher degree of activity compared with others across four dimensions. Note the higher overall activity exhibited by the KO animal, particularly in mid and fore‐brain regions. Composite movies of the activity of these same animals over time are presented in video S1 (WT) and Video S2 (KO). (c) Top ~ functional connectivity of the WT and KO animals indicated by correlations between the temporal patterns of activity shown for each pair of registered brain regions. Data shown as average across all animals per group. Nodes linked by a grey line showed Pearson's correlation coefficient R of >0.70, those in red >0.95. Nodes labelled in Green showed 5 or more significant connections, in blue, 10 or more, and in red 20 or more connections. Some of these correlations showed a significant change between the WT and KO animal groups indicating an increase or decrease in the strength of the connection between those two regions (summarized in table at the bottom of the panel. Mann‐Whitney test with Bonferroni corrected α = 0.0012). Abbreviated brain regions are: Area postrema (AP); Cerebellum (C); Corpus cerebelli (CC); Dorsal thalamus (DT); Eyes (E); Eminentia granularis (EG); Eminentia thalami (ET); Habenulae (H); Intermediate thalamus (I); Inferior olive (IO); Interpeduncular nucleus (IPN); Lobus caudalis cerebelli (LC); Locus coeruleus (Lco); Lateral reticular nucleus (LRN); Mauthner (Mt); Medial vestibular nucleus (MVN); Noradrenergic neurons of the interfascicular and vagal areas (NIV); Spinal cord neuropil (Np); Olfactory bulb (OB); Olfactory epithelium (OE); Pineal gland (P); Preoptic Area (PA); Pallium (Pa); Pretectum (PT); Raphe inferior (RI); Raphe superior (RS); Spinal cord (SC); Subpallium (Sp); Posterior tuberculum (TB); Torus longitudinalis (TL); Tegmentum (Tm); Tectum neuropil (TN); Torus semicircularis (TSC); Tectum stratum periventriculare (TSP); Tangential vestibular nucleus (TVN); Valvula cerebelli (V); Vagal ganglia (VG); Ventral Thalamus (VT) PHENOTYPE:
|