
|
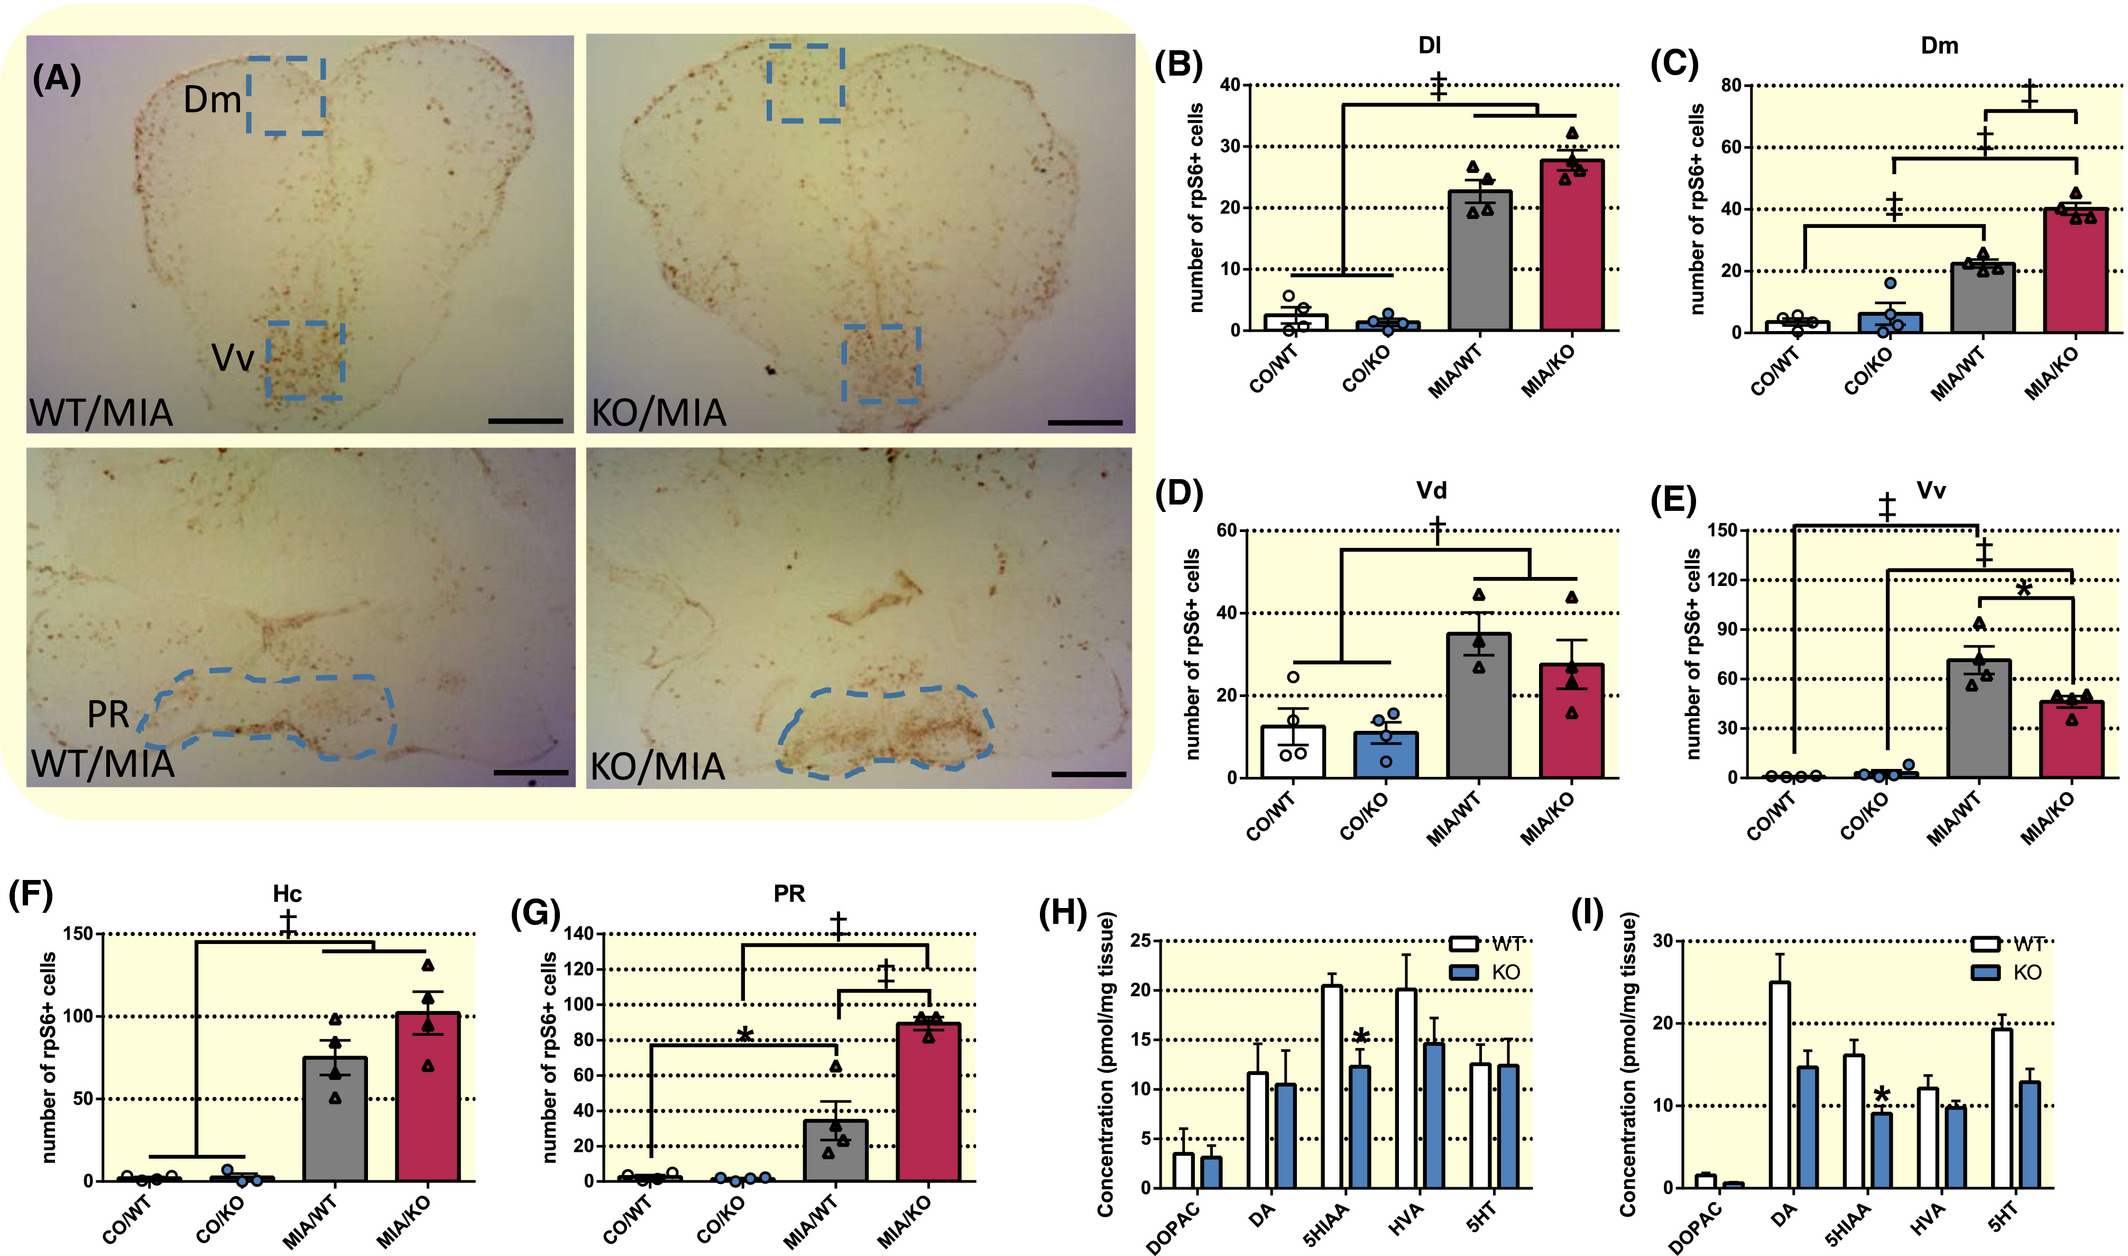
Fig. 3 Effects of histamine receptor H3 (hrh3) deletion on neuronal activation and neurotransmitter levels. A, Representative images depicting differences in rpS6 immunoreactivity between aggression‐exposed wild‐type (WT/MIA) and mutant fish (KO/MIA) in the telencephalon and hypothalamus. The selected counting areas are indicated in blue. Scale bar: 150 µm. B‐G, Number of ribosomal protein S6 (rpS6)+ cells in (B) the lateral and (C) medial zone of the dorsal telencephalic area (Dl and Dm), (D) the dorsal and (E) ventral nuclei of the ventral telencephalic area (Vd and Vv), (F) the caudal zone of the periventricular hypothalamus (Hc) and (G) the area around the posterior recess of the diencephalic ventricle (PR) in hrh3−/− (KO) and corresponding wild‐type (WT) fish under basal conditions (CO) and after 1 h aggression exposure (MIA). n = 3‐4. Two‐way ANOVA followed by Tukey's post‐hoc test in case of a significant interaction term. Otherwise significant main effects are indicated in the graph. ‡P < .001, †P < .01, *P < .05 (H and I) HPLC measurements of neurotransmitter and neurotransmitter metabolite levels in (H) the telencephalon and (I) diencephalon. n = 5‐7. Bonferroni‐corrected t tests.*P < .05 vs 5‐HIAA WT levels. Data are presented as mean ± SEM