
|
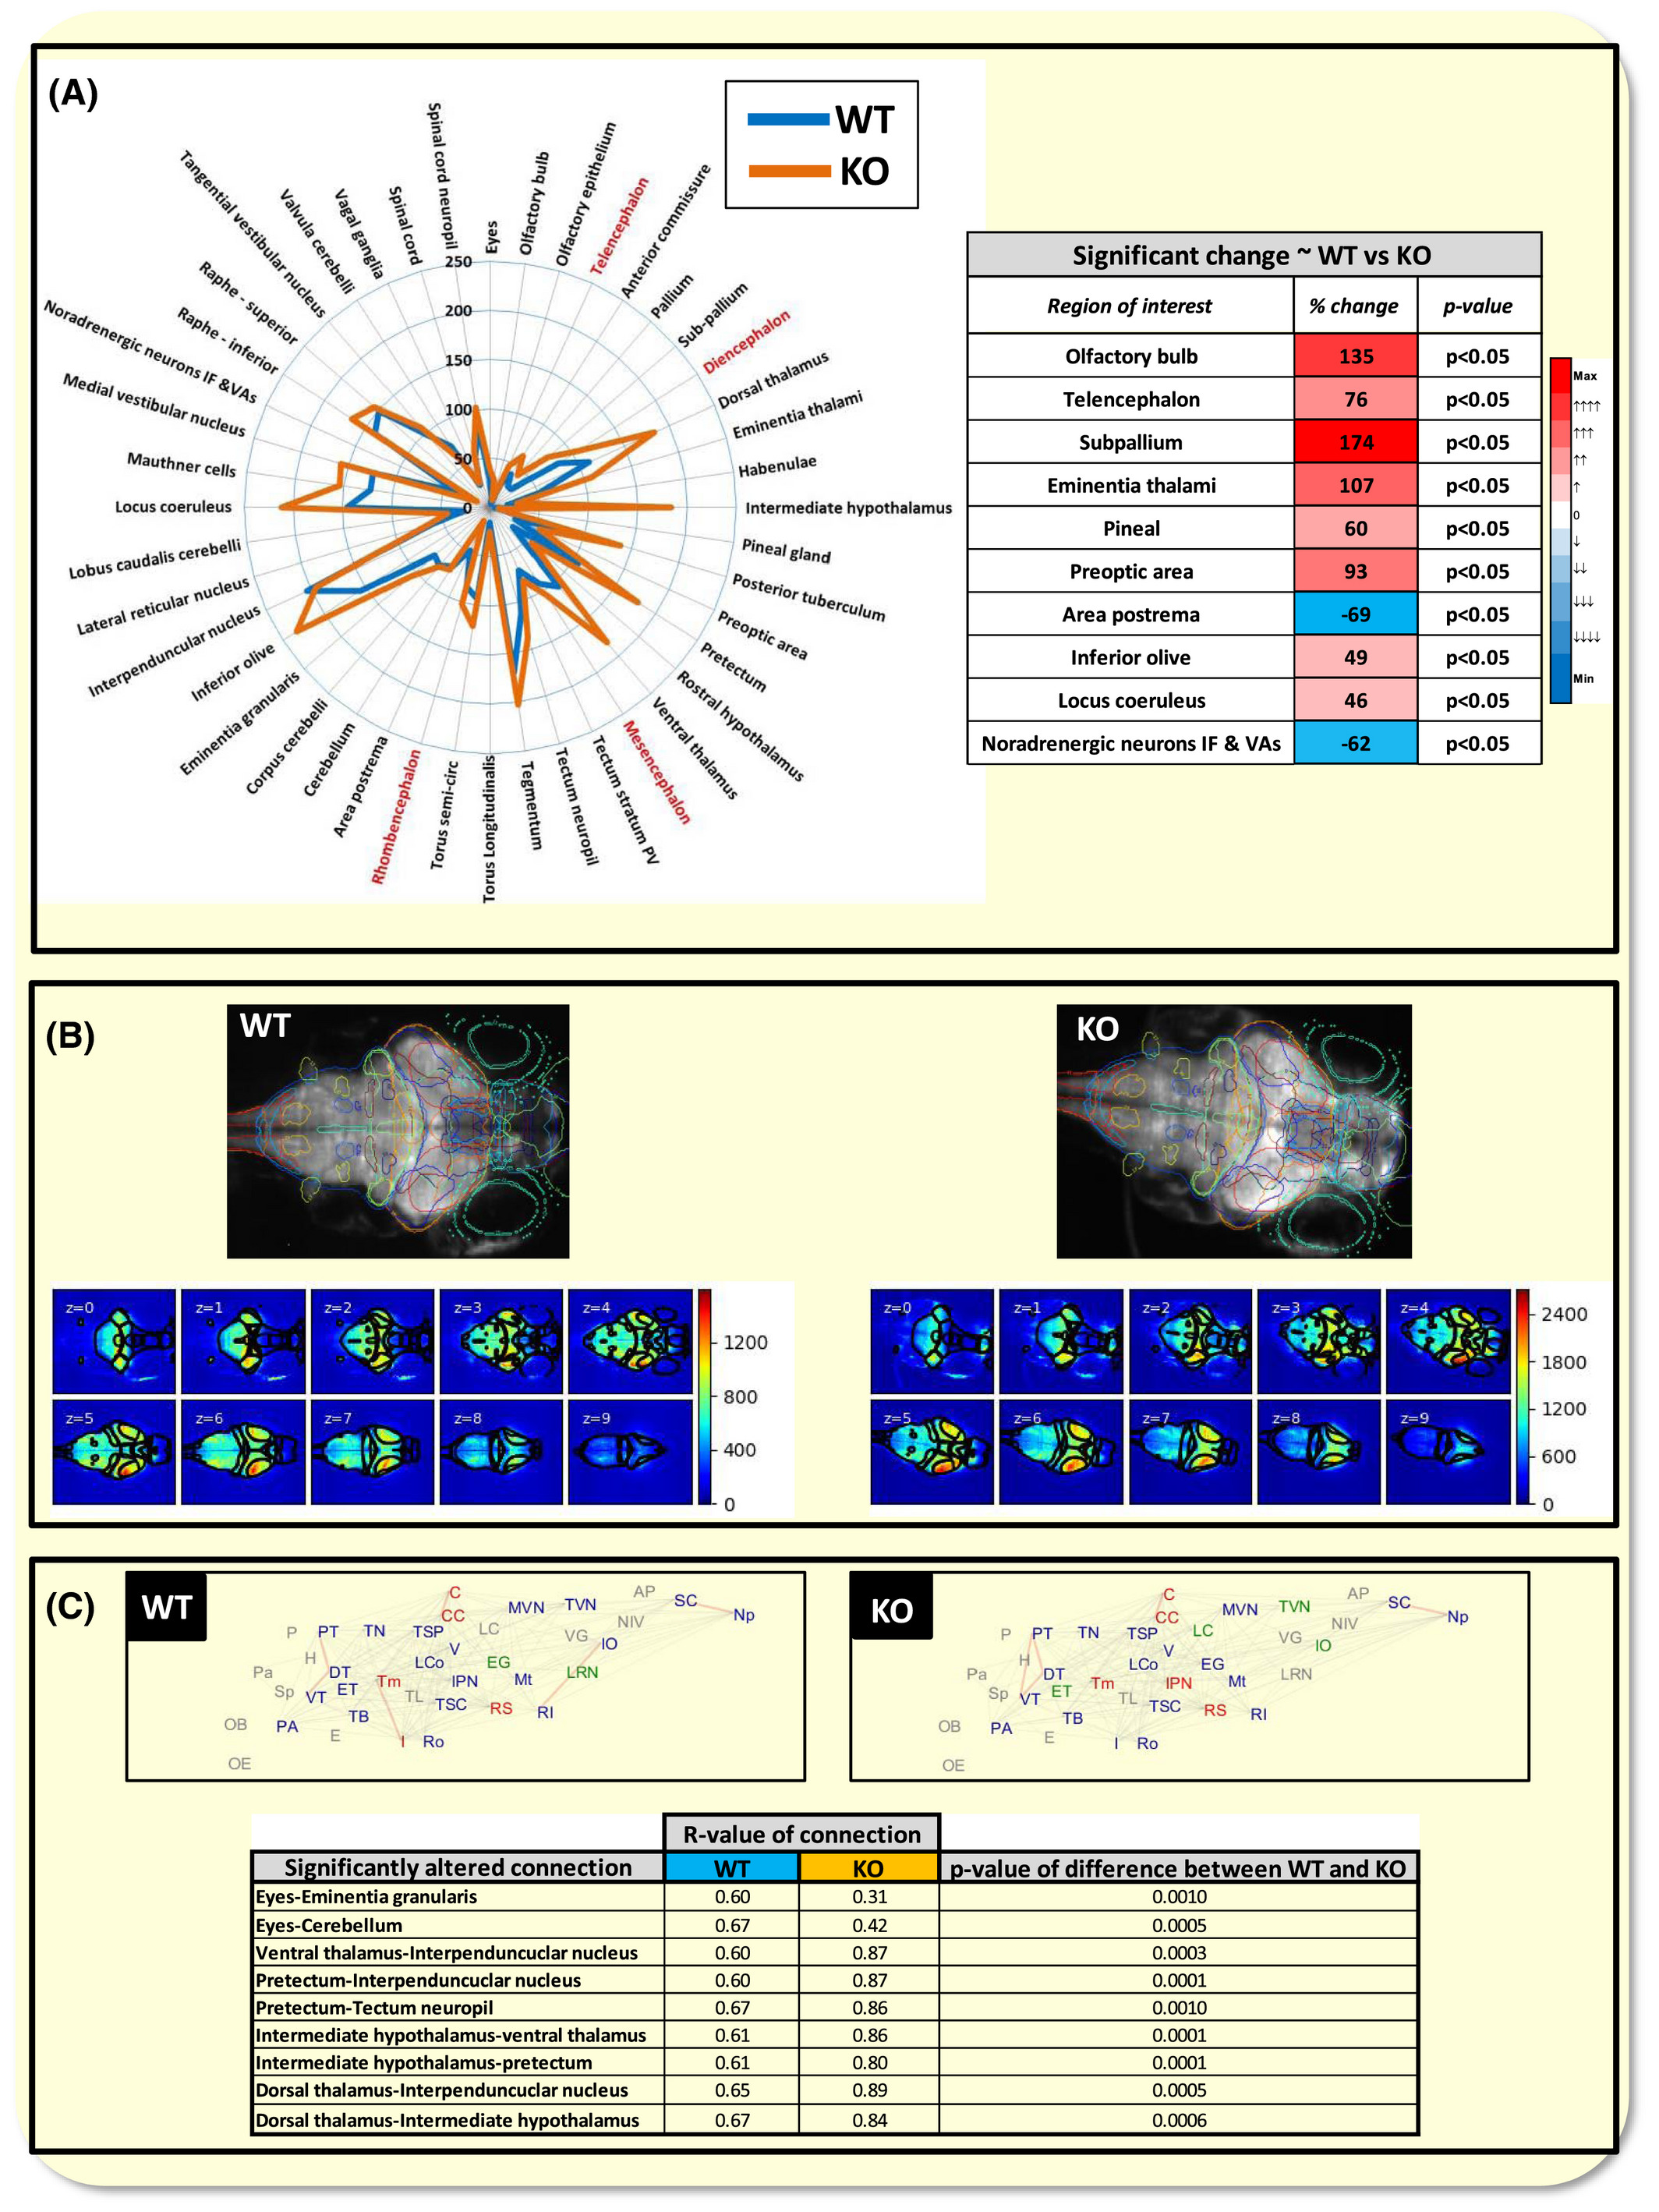
Fig. 6 Effects of histamine receptor H3 (hrh3) deletion on whole brain neural activity and functional connectivity between specific brain regions. (a) Left ~ radar plot showing changes in peak fluorescence intensity between wild‐type (WT) and mutants (KO) within each registered brain region. Gross regions shown in red, and subregions in black (abbreviations: IF &VAs = interfascicular and vagal areas; PV = periventriculare). Note changes in activity within specific brain regions some of which were significantly different between WT and KO shown in the table on the right. (Mann‐Whitney or t test, α = 0.05, n = 15). Colour coding in the table shows the degree of increase (red) or decrease (blue) in values from the WT to the KO, with darker shades showing a higher degree of change relative to other regions within that treatment group. (b) Top ~ example WT and KO maximum projections of neural activity overlaid by outlines of the registered regions of interest from which the peak fluorescence intensity values were extracted. The lower images are the corresponding median intensity projections obtained at each Z‐level from these example animals showing which regions exhibited higher degree of activity compared with others across four dimensions. Note the higher overall activity exhibited by the KO animal, particularly in mid and fore‐brain regions. Composite movies of the activity of these same animals over time are presented in video S1 (WT) and Video S2 (KO). (c) Top ~ functional connectivity of the WT and KO animals indicated by correlations between the temporal patterns of activity shown for each pair of registered brain regions. Data shown as average across all animals per group. Nodes linked by a grey line showed Pearson's correlation coefficient R of >0.70, those in red >0.95. Nodes labelled in Green showed 5 or more significant connections, in blue, 10 or more, and in red 20 or more connections. Some of these correlations showed a significant change between the WT and KO animal groups indicating an increase or decrease in the strength of the connection between those two regions (summarized in table at the bottom of the panel. Mann‐Whitney test with Bonferroni corrected α = 0.0012). Abbreviated brain regions are: Area postrema (AP); Cerebellum (C); Corpus cerebelli (CC); Dorsal thalamus (DT); Eyes (E); Eminentia granularis (EG); Eminentia thalami (ET); Habenulae (H); Intermediate thalamus (I); Inferior olive (IO); Interpeduncular nucleus (IPN); Lobus caudalis cerebelli (LC); Locus coeruleus (Lco); Lateral reticular nucleus (LRN); Mauthner (Mt); Medial vestibular nucleus (MVN); Noradrenergic neurons of the interfascicular and vagal areas (NIV); Spinal cord neuropil (Np); Olfactory bulb (OB); Olfactory epithelium (OE); Pineal gland (P); Preoptic Area (PA); Pallium (Pa); Pretectum (PT); Raphe inferior (RI); Raphe superior (RS); Spinal cord (SC); Subpallium (Sp); Posterior tuberculum (TB); Torus longitudinalis (TL); Tegmentum (Tm); Tectum neuropil (TN); Torus semicircularis (TSC); Tectum stratum periventriculare (TSP); Tangential vestibular nucleus (TVN); Valvula cerebelli (V); Vagal ganglia (VG); Ventral Thalamus (VT)