- Title
-
Development of vascular regulation in the zebrafish embryo
- Authors
- Bahrami, N., Childs, S.J.
- Source
- Full text @ Development
|
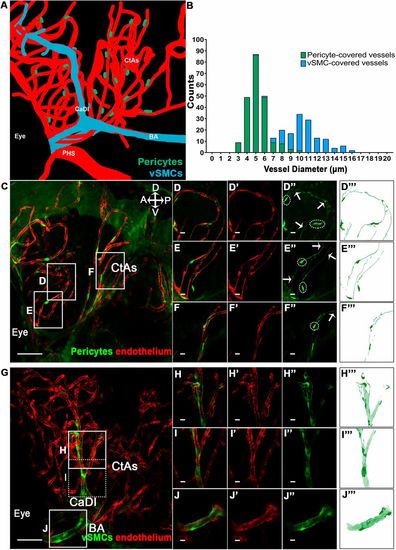
Mural cell morphology and coverage of the cerebral vasculature at 6 dpf. (A) A model of vSMC and pericyte locations on 6 dpf zebrafish embryo cerebral vessels. PHS, primordial hindbrain sinus; CaDI, caudal division of the internal carotid artery; BA, basilar artery; CtAs, central arteries. (B) Pericytes are typically found on vessels with diameters of ≤6.5 μm (n=215 pericyte-covered vessel regions), while vSMCs appear on the larger cerebral vessels (≥9.5 μm; n=130 vSMC-covered vessel regions). Cerebral vessels with diameters of 6.5-9.5 μm are covered by a mix of pericytes and vSMCs. (C) Lateral image of cerebral vessel pericyte coverage at 6 dpf. (D-F‴) Enlargements of vessels in C, highlighting contact between processes of different pericytes. Dotted lines outline pericyte cell bodies; arrows mark processes. (G) Lateral image of cerebral vessel vSMC coverage at 6 dpf, focusing on the CaDI and BA. (H-J‴) Enlargements of the vessels in G showing extensive vSMC coverage. Scale bars: 50 µm in C and G; 10 µm in D-F‴,H-J‴. A, P, V and D refer to anterior, posterior, ventral and dorsal. |
|
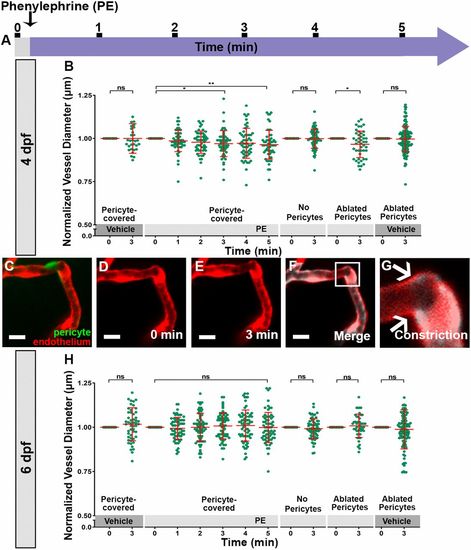
Pericyte-covered vessels constrict in response to phenylephrine at 4 dpf but not at 6 dpf. (A) Schematic of the experimental timeline. Imaging occurs prior to addition of 10 µM PE (0 min) and at 1 min intervals over 5 min after drug addition. (B) At 4 dpf, pericyte-covered vessels constrict in response to PE within 3 min (P=0.007, n=55 from 15 embryos). There was no constriction with vehicle (P=0.416, n=29 from 8 embryos). Vessel regions with no pericytes and diameters ≤6.5 μm did not respond to PE (P=0.972, n=69 from 18 embryos). When pericytes were ablated, ≤6.5 µm diameter vessels constricted in response to PE (P=0.0003, n=46 from 10 embryos) but not to vehicle (P=0.289, n=128 from 22 embryos). (C-G) An example of pericyte-covered vessel constriction in response to PE within 3 min. F is an overlay of D and E. Arrows indicate constriction between the two time points. (H) At 6 dpf, pericyte-covered vessels did not respond to PE (P=0.553, n=68 from 15 embryos). Scale bars: 10 µm in C-F. Values are mean±s.d. with individual data points indicated. Significance was determined using a repeated measure one-way ANOVA (*P≤0.05, **P≤0.005). |
|
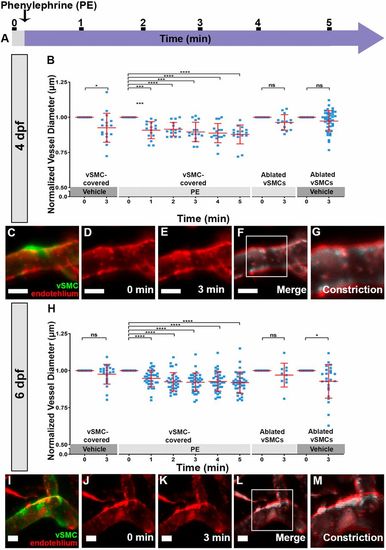
Vessel constriction in developing vSMCs in response to phenylephrine. (A) Schematic of the experimental timeline. Imaging occurs prior to addition of 10 μM PE (0 min) and at 1 min intervals over 5 min after drug addition. (B) At 4 dpf, vSMCs constrict in response to PE (P≤0.0001, n=16 from 15 embryos) and to the vehicle control (P=0.005, n=17 from 9 embryos). When the vSMCs are ablated, there is constriction in response to both PE (P=0.070, n=14 from 10 embryos) and vehicle (P=0.0001, n=42 from 21 embryos). (C-G) An example of vSMC-covered vessel constriction in response to PE within 3 min at 4 dpf. F is an overlay of D and E. (H) At 6 dpf, vSMC-covered vessels significantly constrict in response to PE (P=0.0001, n=38 from 22 embryos) but not to vehicle (P=0.161, n=22 from 13 embryos). When vSMCs are ablated, there is no response to PE (P≤0.314, n=10 from 9 embryos) but there is constriction in response to the vehicle control (P=0.003, n=24 from 18 embryos). (I-M) An example of vSMC-covered vessel constriction to PE at 6 dpf. L is an overlay of J and K. Scale bars: 10 μm in C-F,I-L. Data are mean±s.d. Significance was determined using a repeated measure one-way ANOVA (*P≤0.05, ***P≤0.0005, ****P≤0.00005). ns, not significant. |
|
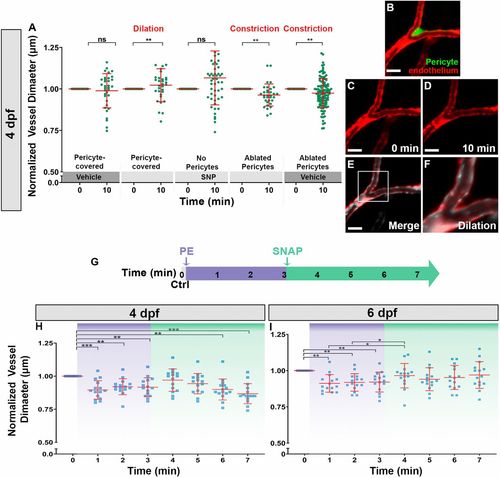
Pericyte-covered vessels dilate at 4 dpf, while vSMCs dilate at 6 dpf but only from a pre-constricted state. (A) Pericyte-covered vessels dilate in response to SNP (P=0.005, n=53 from 15 embryos). When pericytes are ablated, ≤6.5 μm diameter vessels constrict in response to both the vehicle (P=0.002, n=115 from 18 embryos) and SNP (P=0.003, n=33 from 10 embryos). (B-F) An example of pericyte-covered vessel dilation to SNP at 4 dpf. E and F are overlays of C and D. (G) Experimental timeline for the pre-constriction followed by dilation of vSMC-covered vessels. Embryos were imaged prior to drug addition (0 min), followed by 3 min of exposure to PE (10 μM) and then to 4 min of exposure to SNAP (100 μM). Embryos were imaged every minute. (H) At 4 dpf, vSMC-covered vessels do not dilate from a pre-constricted state (P≤0.0001, n=15 from 11 embryos) after SNAP exposure. (I) At 6 dpf, vSMC-covered vessels dilate from a pre-constricted state (P≤0.0002, n=15 from 13 embryos). The shading in H and I highlight drug exposures and the corresponding changes in vSMC-covered vessel diameter according to the experimental timeline (G). Scale bars: 10 μm in B-E. Data are mean±s.d. Significance was determined using a paired two-tailed t-test for A and a repeated measures one-way ANOVA for H-I (*P≤0.05, **P≤0.005, ***P≤0.0005). ns, not significant. |


