
|
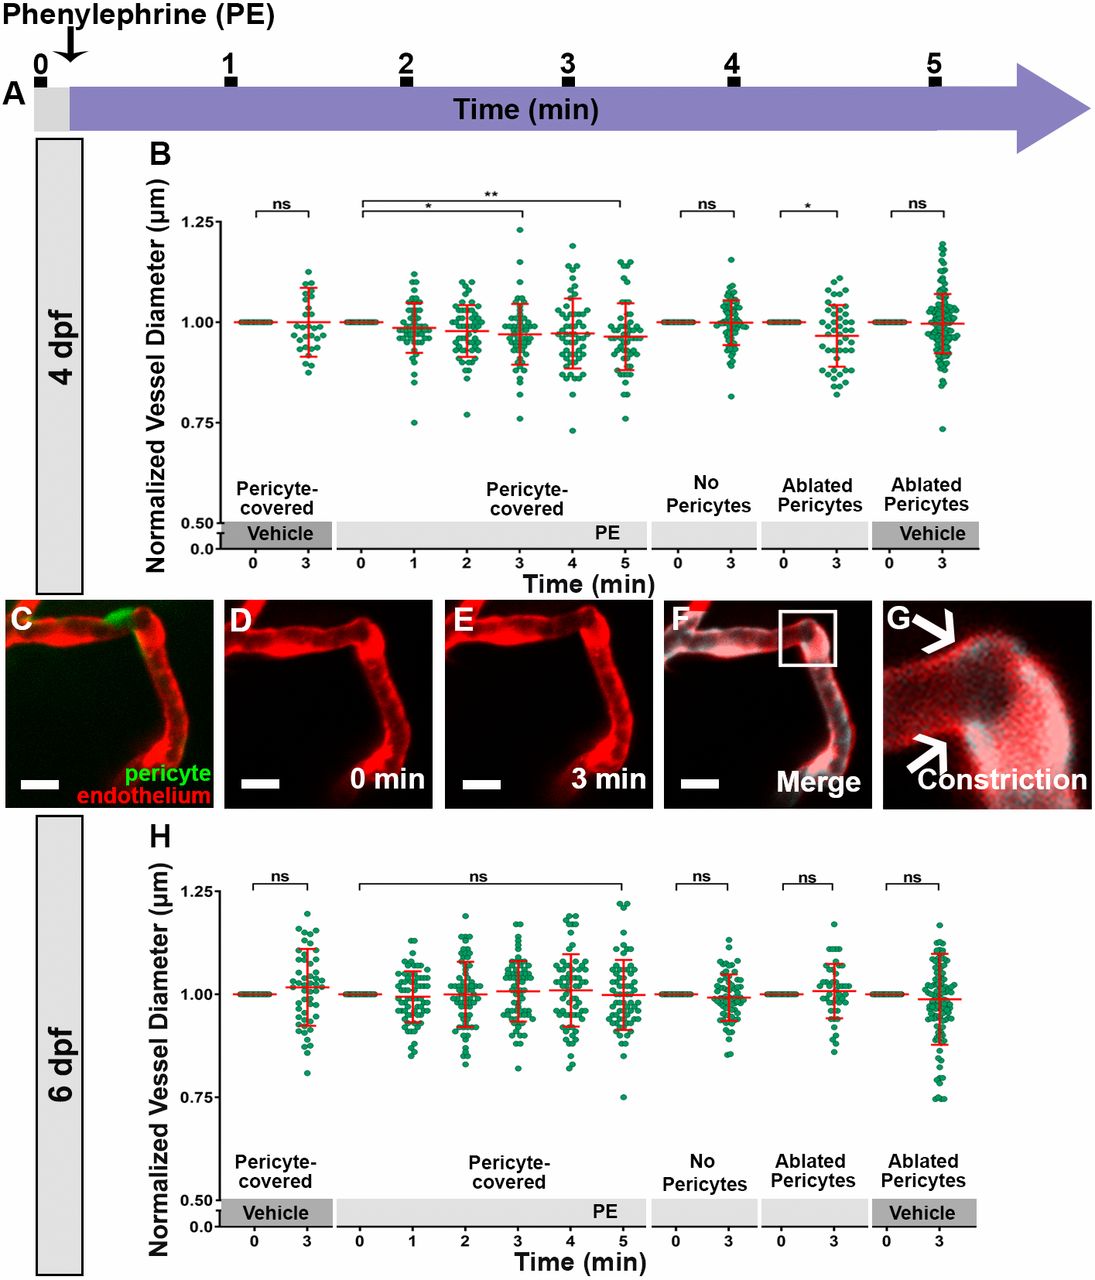
Fig. 2 Pericyte-covered vessels constrict in response to phenylephrine at 4 dpf but not at 6 dpf. (A) Schematic of the experimental timeline. Imaging occurs prior to addition of 10 µM PE (0 min) and at 1 min intervals over 5 min after drug addition. (B) At 4 dpf, pericyte-covered vessels constrict in response to PE within 3 min (P=0.007, n=55 from 15 embryos). There was no constriction with vehicle (P=0.416, n=29 from 8 embryos). Vessel regions with no pericytes and diameters ≤6.5 μm did not respond to PE (P=0.972, n=69 from 18 embryos). When pericytes were ablated, ≤6.5 µm diameter vessels constricted in response to PE (P=0.0003, n=46 from 10 embryos) but not to vehicle (P=0.289, n=128 from 22 embryos). (C-G) An example of pericyte-covered vessel constriction in response to PE within 3 min. F is an overlay of D and E. Arrows indicate constriction between the two time points. (H) At 6 dpf, pericyte-covered vessels did not respond to PE (P=0.553, n=68 from 15 embryos). Scale bars: 10 µm in C-F. Values are mean±s.d. with individual data points indicated. Significance was determined using a repeated measure one-way ANOVA (*P≤0.05, **P≤0.005).