
|
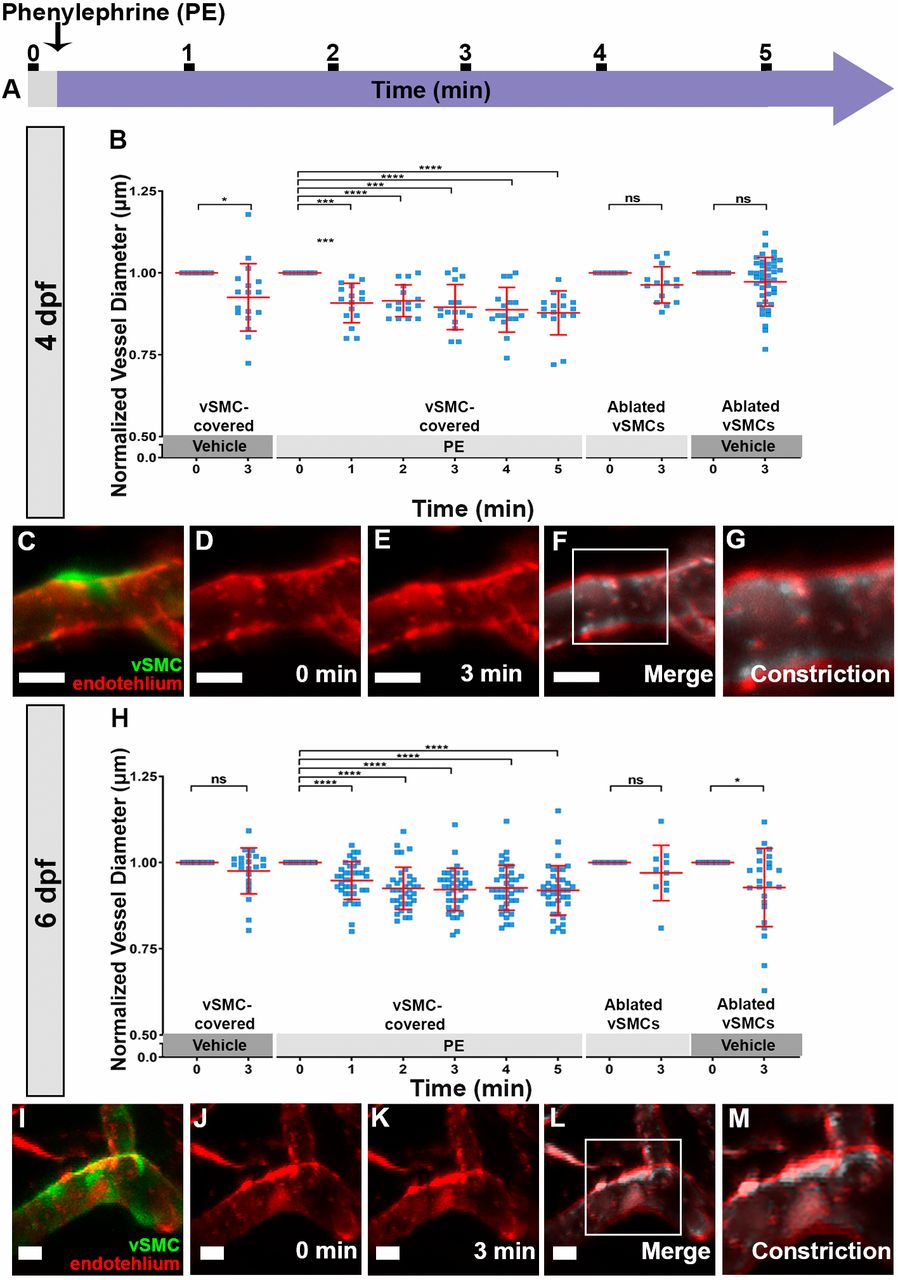
Fig. 3 Vessel constriction in developing vSMCs in response to phenylephrine. (A) Schematic of the experimental timeline. Imaging occurs prior to addition of 10 μM PE (0 min) and at 1 min intervals over 5 min after drug addition. (B) At 4 dpf, vSMCs constrict in response to PE (P≤0.0001, n=16 from 15 embryos) and to the vehicle control (P=0.005, n=17 from 9 embryos). When the vSMCs are ablated, there is constriction in response to both PE (P=0.070, n=14 from 10 embryos) and vehicle (P=0.0001, n=42 from 21 embryos). (C-G) An example of vSMC-covered vessel constriction in response to PE within 3 min at 4 dpf. F is an overlay of D and E. (H) At 6 dpf, vSMC-covered vessels significantly constrict in response to PE (P=0.0001, n=38 from 22 embryos) but not to vehicle (P=0.161, n=22 from 13 embryos). When vSMCs are ablated, there is no response to PE (P≤0.314, n=10 from 9 embryos) but there is constriction in response to the vehicle control (P=0.003, n=24 from 18 embryos). (I-M) An example of vSMC-covered vessel constriction to PE at 6 dpf. L is an overlay of J and K. Scale bars: 10 μm in C-F,I-L. Data are mean±s.d. Significance was determined using a repeated measure one-way ANOVA (*P≤0.05, ***P≤0.0005, ****P≤0.00005). ns, not significant.