
|
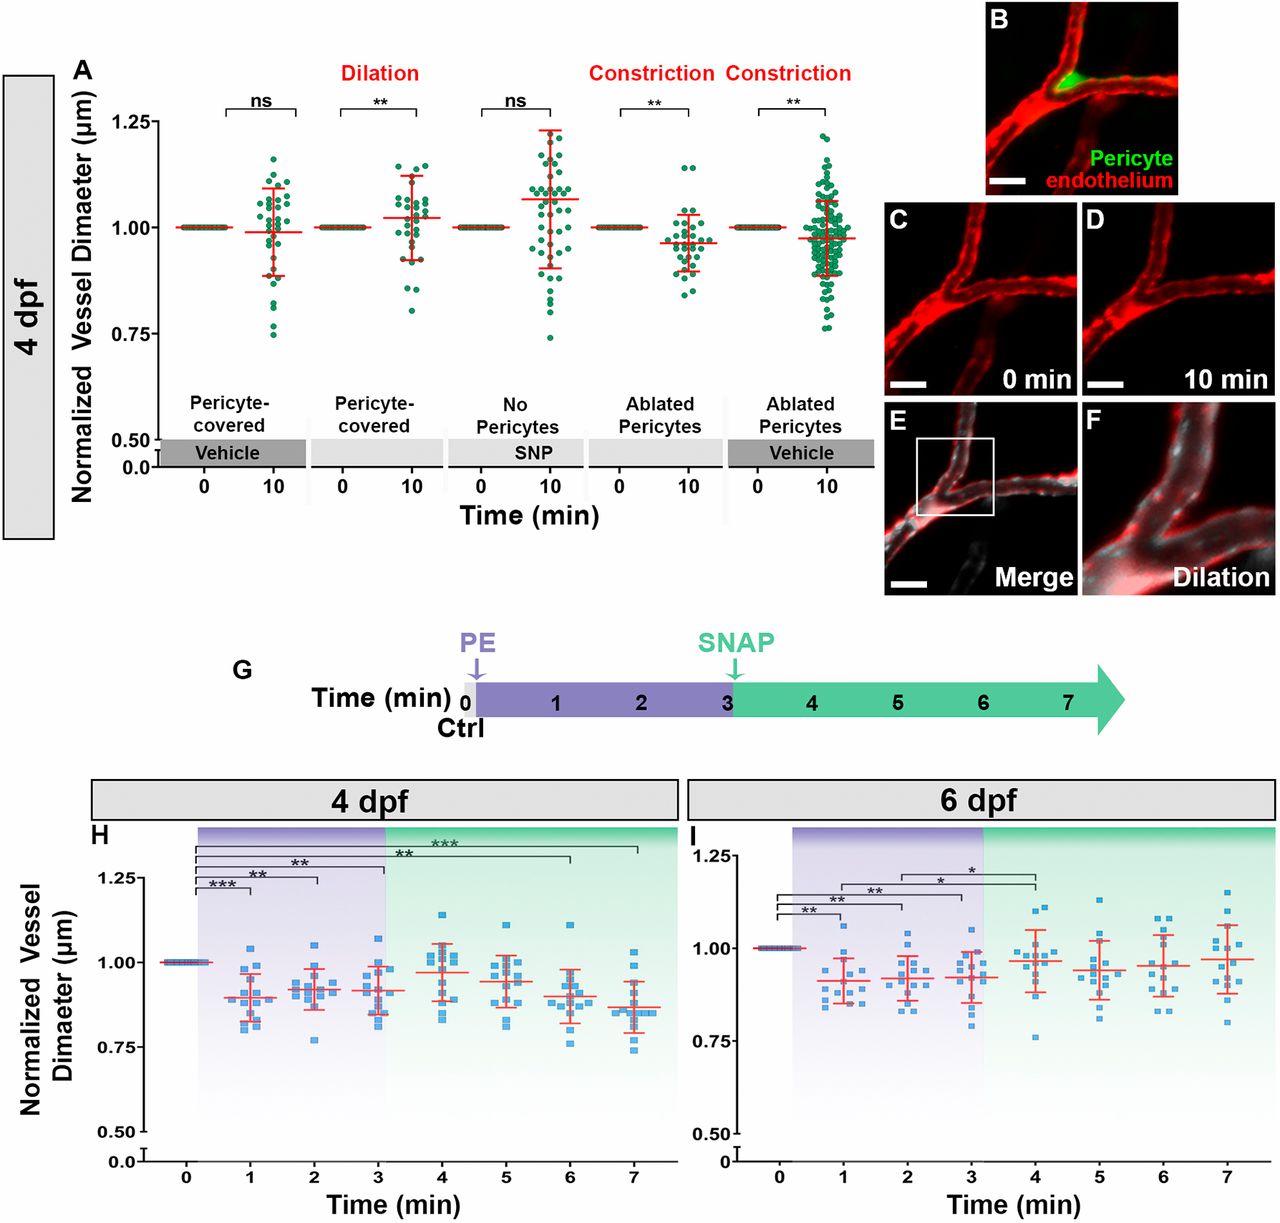
Fig. 4 Pericyte-covered vessels dilate at 4 dpf, while vSMCs dilate at 6 dpf but only from a pre-constricted state. (A) Pericyte-covered vessels dilate in response to SNP (P=0.005, n=53 from 15 embryos). When pericytes are ablated, ≤6.5 μm diameter vessels constrict in response to both the vehicle (P=0.002, n=115 from 18 embryos) and SNP (P=0.003, n=33 from 10 embryos). (B-F) An example of pericyte-covered vessel dilation to SNP at 4 dpf. E and F are overlays of C and D. (G) Experimental timeline for the pre-constriction followed by dilation of vSMC-covered vessels. Embryos were imaged prior to drug addition (0 min), followed by 3 min of exposure to PE (10 μM) and then to 4 min of exposure to SNAP (100 μM). Embryos were imaged every minute. (H) At 4 dpf, vSMC-covered vessels do not dilate from a pre-constricted state (P≤0.0001, n=15 from 11 embryos) after SNAP exposure. (I) At 6 dpf, vSMC-covered vessels dilate from a pre-constricted state (P≤0.0002, n=15 from 13 embryos). The shading in H and I highlight drug exposures and the corresponding changes in vSMC-covered vessel diameter according to the experimental timeline (G). Scale bars: 10 μm in B-E. Data are mean±s.d. Significance was determined using a paired two-tailed t-test for A and a repeated measures one-way ANOVA for H-I (*P≤0.05, **P≤0.005, ***P≤0.0005). ns, not significant.