
- Title
-
Rab5c-mediated endocytic trafficking regulates hematopoietic stem and progenitor cell development via Notch and AKT signaling
- Authors
- Heng, J., Lv, P., Zhang, Y., Cheng, X., Wang, L., Ma, D., Liu, F.
- Source
- Full text @ PLoS Biol.
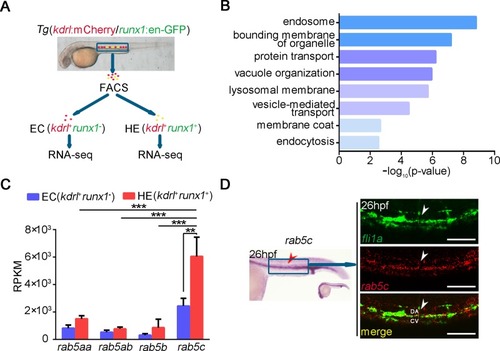
(A) Flowchart of FACS and RNA-seq analysis of the different types of cells in the trunk region from EXPRESSION / LABELING:
|
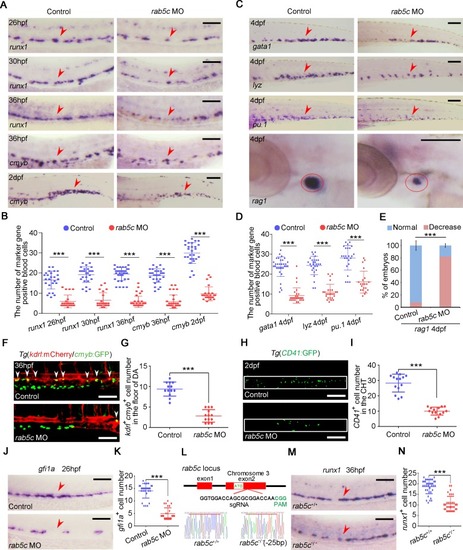
(A) Expression of HSPC markers EXPRESSION / LABELING:
|
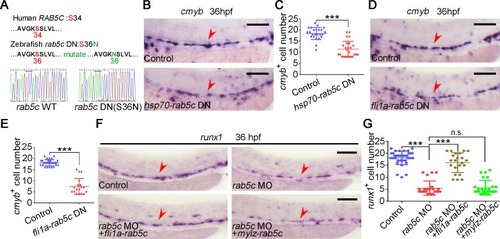
(A) Amino acid sequence is conserved for GTP-binding pockets of the Rab5c proteins between human and zebrafish. The amino acid of zebrafish in red was mutated to generate DN Rab protein by affecting GTP/GDP affinity. (B) Expression of |
(A) The |
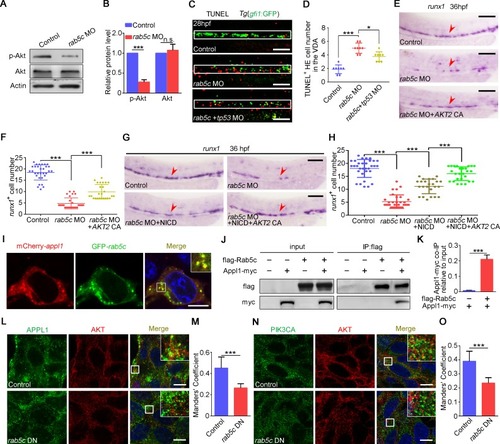
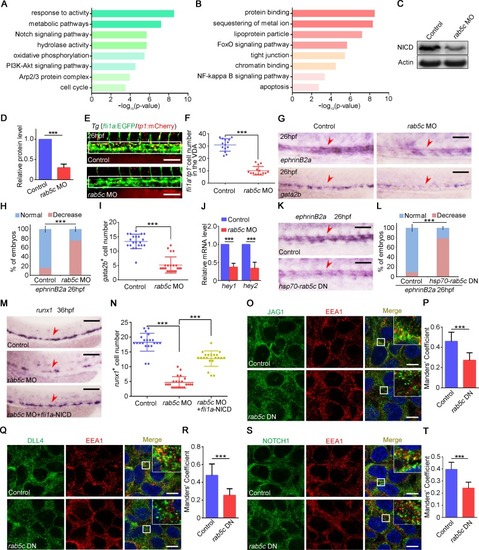
(A) Protein level of p-Akt and total Akt in the control and the |
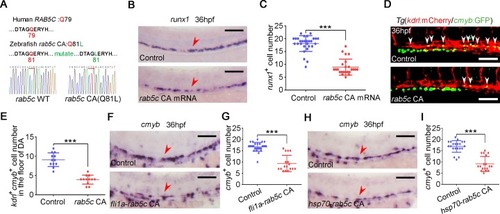
(A) Amino acid sequence is conserved for GTP hydrolysis of the Rab5c proteins between human and zebrafish. The amino acid of zebrafish in red was mutated to generate CA Rab protein by affecting GTPase activity. (B) WISH analysis shows that |
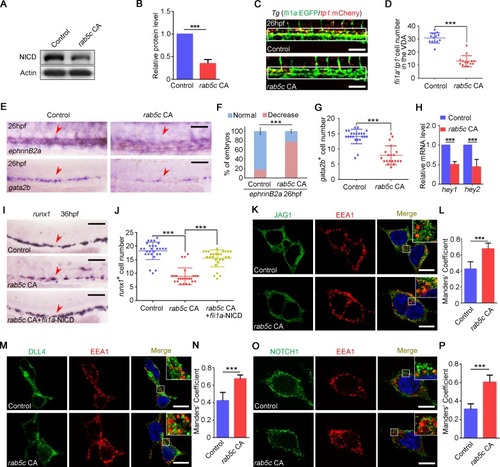
(A) Protein level of NICD in control and |