|
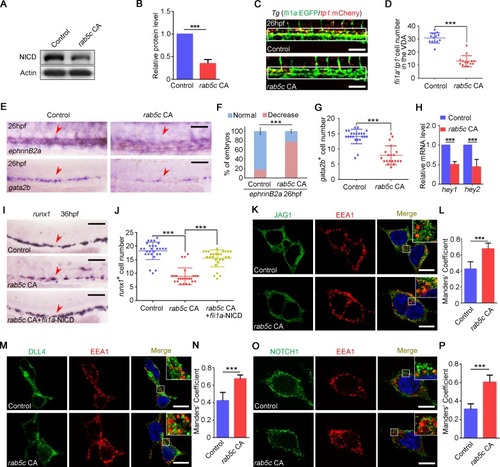
Excessive endocytic trafficking mediated by Rab5c overactivation impairs Notch signaling during HSPC specification.(A) Protein level of NICD in control and rab5c CA group at 26 hpf examined by WB. (B) Quantification of protein level using gray analysis. Error bars, mean ± SD, ***P < 0.001. (C) Confocal imaging shows the fli1a+tp1+ Notch-active ECs in the VDA region (box area) of control and rab5c CA group. Scale bar, 100 μm. (D) Quantification of fli1a+tp1+ Notch-active ECs. Error bars, mean ± SD, ***P < 0.001. (E) Expression of Notch downstream genes ephrinB2a and gata2b in control and rab5c CA group at 26 hpf examined by WISH. Scale bar, 100 μm. (F) Statistical analysis of the WISH. Error bars, mean ± SD, ***P < 0.001. (G) Quantification of the gata2b positive cells. Error bars, mean ± SD, ***P < 0.001. (H) Relative mRNA level of Notch signaling downstream genes hey1, hey2 in the control and the rab5c CA group at 26 hpf examined by qRT-PCR. Error bars, mean ± SD, ***P < 0.001. (I) WISH analysis shows that runx1 expression in Rab5c CA HS overexpression group is partially rescued by NICD overexpression through fli1a-NICD. Scale bar, 100 μm. (J) Quantification of the runx1 positive cells. Error bars, mean ± SD, ***P < 0.001. (K) Control plasmid or pCS2-rab5c CA transfected 293T cells were immunostained with antibodies against endogenous JAG1 (green) and EEA1 (red). Scale bar, 10 μm. (L) Quantification of co-localization of JAG1 with EEA1 using Manders’ coefficient (ImageJ). n = 13 cells. Error bars, mean ± SD, ***P < 0.001. (M) Control plasmid or pCS2-rab5c CA transfected 293T cells were immunostained with antibodies against endogenous DLL4 (green) and EEA1 (red). Scale bar, 10 μm. (N) Quantification of co-localization of DLL4 with EEA1 using Manders’ coefficient. n = 12 cells. Error bars, mean ± SD, ***P < 0.001. (O) Control plasmid or pCS2-rab5c CA transfected 293T cells were immunostained with antibodies against endogenous NOTCH1 (green) and EEA1 (red). Scale bar, 10 μm. (P) Quantification of co-localization of NOTCH1 with EEA1 using Manders’ coefficient. n = 14 cells. Error bars, mean ± SD, ***P < 0.001. The P values in this figure were calculated by Student t test. The underlying data in this figure can be found in S1 Data. CA, constitutively active; EC, endothelial cell; hpf, hours post fertilization; HS, heat shock; HSPC, hematopoietic stem and progenitor cell; NICD, Notch intracellular domain; qRT-PCR, quantitative reverse-transcription PCR; VDA, ventral wall of the dorsal aorta; WB, western blot; WISH, whole-mount in situ hybridization.
|