|
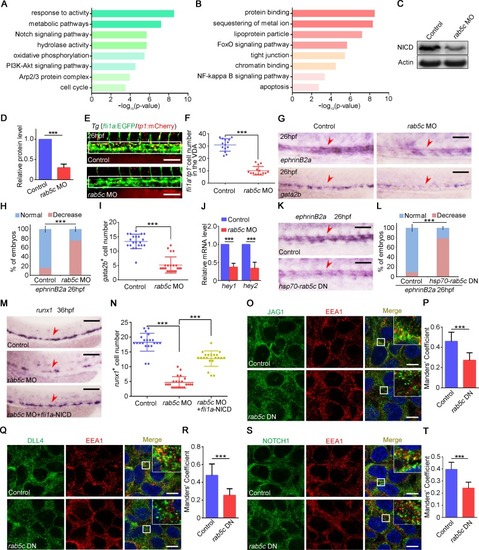
Rab5c-regulated endocytic trafficking is important for HE specification through Notch signaling.(A) The fli1a+ ECs were sorted from the trunk region of the control and the rab5c morphants at 26 hpf for RNA-seq. The GO analysis showing the enrichment of down-regulated signaling pathways in rab5c morphants. (B) GO analysis showing the enrichment of up-regulated signaling pathways in rab5c morphants. (C) Protein level of NICD in the control and the rab5c morphants at 26 hpf examined by WB. (D) Quantification and statistical analysis of WB. Quantification of protein level using gray analysis (Gel-Pro analyzer). Error bars, mean ± SD, ***P < 0.001. (E) Confocal imaging shows the fli1a+tp1+ Notch-active ECs in the VDA region (box area) of the control and the rab5c morphants. Scale bar, 100 μm. (F) Quantification of fli1a+tp1+ Notch-active ECs. Error bars, mean ± SD, ***P < 0.001. (G) Expression of Notch downstream genes ephrinB2a and gata2b in the control and the rab5c morphants at 26 hpf examined by WISH. Scale bar, 100 μm. (H) Statistical analysis of the WISH. Error bars, mean ± SD, ***P < 0.001. (I) Quantification of the gata2b positive cells. Error bars, mean ± SD, ***P < 0.001. (J) Relative mRNA level of Notch signaling downstream genes hey1, hey2 in the control and the rab5c morphants at 26 hpf examined by qRT-PCR. Error bars, mean ± SD, ***P < 0.001. (K) Expression of ephrinB2a in control and Rab5c inhibition group examined by WISH. rab5c DN overexpression was carried out by hsp70-GFP-rab5c DN HS at 20 hpf. Scale bar, 100 μm. (L) Statistical analysis of the WISH. Error bars, mean ± SD, ***P < 0.001. (M) WISH shows that runx1 expression in rab5c morphants is partially rescued by NICD overexpression through fli1a-NICD. Scale bar, 100 μm. (N) Quantification of the runx1 positive cells. Error bars, mean ± SD, ***P < 0.001. (O) Control plasmid or pCS2-rab5c DN transfected 293T cells were immunostained with antibodies against endogenous JAG1 (green) and EEA1 (red). Scale bar, 10 μm. (P) Quantification of co-localization of JAG1 with EEA1 using Manders’ coefficient (ImageJ). n = 14 cells. Error bars, mean ± SD, ***P < 0.001. (Q) Control plasmid or pCS2-rab5c DN transfected 293T cells were immunostained with antibodies against endogenous DLL4 (green) and EEA1 (red). Scale bar, 10 μm. (R) Quantification of co-localization of DLL4 with EEA1 using Manders’ coefficient. n = 14 cells. Error bars, mean ± SD, ***P < 0.001. (S) Control plasmid or pCS2-rab5c DN transfected 293T cells were immunostained with antibodies against endogenous NOTCH1 (green) and EEA1 (red). Scale bar, 10 μm. (T) Quantification of co-localization of NOTCH1 with EEA1 using Manders’ coefficient. n = 14 cells. Error bars, mean ± SD, ***P < 0.001. The P values in this figure were calculated by Student t test. The underlying data in this figure can be found in S1 Data. DN, dominant-negative; EC, endothelial cell; GO, gene ontology; HE, hemogenic endothelium; hpf, hours post fertilization; HS, heat shock; NICD, Notch intracellular domain; qRT-PCR, quantitative reverse-transcription PCR; RNA-seq, RNA sequencing; VDA, ventral wall of the dorsal aorta; WB, western blot; WISH, whole-mount in situ hybridization.
|