|
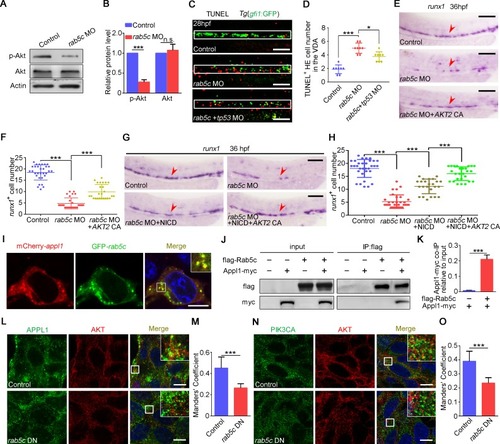
Rab5c is required for HE survival through AKT signaling.(A) Protein level of p-Akt and total Akt in the control and the rab5c morphants examined by WB. (B) Quantification of protein level using gray analysis (Gel-Pro analyzer). Error bars, mean ± SD, ***P < 0.001. (C) TUNEL assay shows that there are more apoptotic HE cells (yellow) in the VDA region (box area) of rab5c morphants compared with the control. Injection of tp53 MO just slightly reduces apoptotic HE cell number in rab5c morphants. Scale bar, 100 μm. (D) Quantification of TUNEL+ HE cells. Error bars, mean ± SD, *P < 0.05, ***P < 0.001. (E) HSPC rescue of rab5c morphants with CA form AKT2 mRNA. Scale bar, 100 μm. (F) Quantification of the runx1 positive cells. Error bars, mean ± SD, ***P < 0.001. (G) Co-overexpression of NICD and AKT2 CA shows a more efficient rescue effect than NICD overexpression alone. Scale bar, 100 μm. (H) Quantification of the runx1 positive cells. Error bars, mean ± SD, ***P < 0.001. (I) Confocal imaging shows partial co-localization of Appl1 and Rab5c in 293T cells co-transfected with pCS2-mCherry-appl1 and pCS2-GFP-rab5c constructs. Scale bar, 10 μm. (J) 293T cells were co-transfected with flag-tagged rab5c and myc-tagged appl1 constructs. Cell lysate was subjected to IP using anti-flag beads followed by WB analysis. (K) Quantification of protein level using gray analysis (Gel-Pro analyzer). The ratios of Appl1-myc co-IP relative to input were calculated. Error bars, mean ± SD, ***P < 0.001. (L) Control plasmid or pCS2-rab5c DN transfected 293T cells were immunostained with antibodies against endogenous APPL1 (green) and AKT (red). Scale bar, 10 μm. (M) Quantification of co-localization of APPL1 with AKT using Manders’ coefficient (ImageJ). n = 14 cells. Error bars, mean ± SD, ***P < 0.001. (N) Control plasmid or pCS2-rab5c DN transfected 293T cells were immunostained with antibodies against endogenous PIK3CA (green) and AKT (red). Scale bar, 10 μm. (O) Quantification of co-localization of PIK3CA with AKT using Manders’ coefficient. n = 14 cells. Error bars, mean ± SD, ***P < 0.001. The P values in this figure were calculated by Student t test. The underlying data in this figure can be found in S1 Data. CA, constitutively active; DN, dominant-negative; GFP, green fluorescent protein; HE, hemogenic endothelium; HSPC, hematopoietic stem and progenitor cell; IP, immunoprecipitation; MO, morpholino; NICD, Notch intracellular domain; n.s., nonsignificant; p-Akt, phosphorylated Akt; PIK3CA, catalytic subunit PI3K-alpha; TUNEL, terminal-deoxynucleoitidyl transferase mediated nick end labeling; VDA, ventral wall of the dorsal aorta; WB, western blot .
|