FIGURE SUMMARY
Title

Deficiency in the endocytic adaptor proteins PHETA1/2 impair renal and craniofacial development

Authors
Ates, K.M., Wang, T., Moreland, T., Veeranan-Karmegam, R., Ma, M., Jeter, C., Anand, P., Wenzel, W., Kim, H.G., Wolfe, L.A., Stephen, J.A., Adams, D.R., Markello, T., Tifft, C.J., Settlage, R., Gahl, W.A., Gonsalvez, G.B., Malicdan, M.C., Flanagan-Steet, H., Pan, Y.A.
Source
Full text @ Dis. Model. Mech.

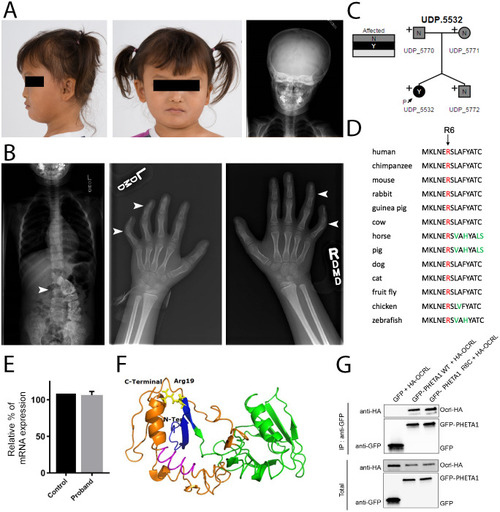
Identification of a de novo mutation in human PHETA1. (A) Images of the UDP patient, presenting with facial asymmetry, concave nasal ridge and malar flattening. Radiograph (right) reveals mild asymmetry of the skull. (B) Radiographs depict scoliosis (arrowhead in left image) and clinodactyly of fourth and fifth digits on both hands (arrowheads in middle and right images). (C) Whole-exome sequencing was performed on both parents and the fraternal twin of the UDP patient. ‘N’ denotes not affected and ‘Y’ denotes affected. The arrow labeled ‘P’ identifies the UDP patient (UDP_5532). ‘+’ indicates the presence of a normal allele, thus marking p.R6C as a heterozygous mutation. (D) COBALT multiple alignment of partial protein sequences of PHETA1 orthologs. The conserved arginine residue is highlighted in red, and amino acid residues that differ from the sequence of the human PHETA1 protein are highlighted in green. The arginine residue is highly conserved across multiple species. (E) Relative quantification of mRNA expression in the patient cells showing that the expression of PHETA1 is not significantly different from that in controls. Error bar represents s.d. from six replicates. (F) 3-D structure of the human PHETA1 protein showing the PH domain (green) with a four-stranded N-terminal and three-stranded C-terminal β-sheet with a helix (orange). The conserved arginine amino acid (Arg19 in the PHETA1 long isoform, yellow) is far from the F&H motif (magenta); however, it stabilizes the folded domain around the C-terminal helix. (G) GFP-tagged full-length WT PHETA1 or PHETA1R6C were expressed in HeLa cells and tested for interaction with full-length HA-tagged OCRL1. Bound proteins detected by western blotting with the indicated antibodies. ‘IP: anti-GFP’ refers to the anti-GFP antibody-bound fraction; ‘Total’ represents the total cell lysate.

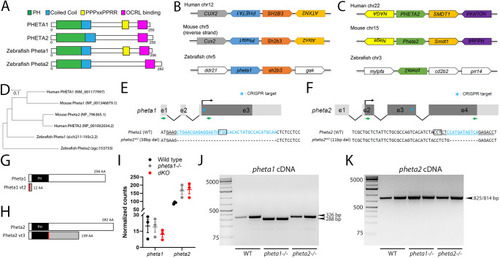
Homology and CRISPR-Cas9 targeting of zebrafish pheta1 and pheta2. (A) The domain structures of human PHETA1, human PHETA2, and the zebrafish PHETA homologs Pheta1 and Pheta2. The PH domain, coiled-coil domain, PPPxPPRR motif and OCRL binding site are highlighted. Like human PHETA2, zebrafish Pheta2 lacks the PPPxPPRR motif. (B,C) Genomic organization of human PHETA1 (B) and PHETA2 (C) and their respective homologs in mouse and zebrafish. (D) Phylogenic tree of PHETA proteins. Units indicate the number of amino acid substitutions per site. (E,F) The diagrams on the top illustrate the genomic structures of pheta1 and pheta2, with the guide RNA (gRNA) target marked with the asterisk. Green arrows indicate the primers for RT-PCR. Sequences at the bottom show the gRNA target (underlined) associated with the protospacer adjacent motif (PAM; boxed letters), and the sequences mutated by CRISPR-Cas9 (blue). (G,H) CRISPR-mediated mutations result in reading frame shifts, causing aberrant protein sequences (gray regions) and premature termination of the protein sequences for Pheta1 (G) and Pheta2 (H). The start of frameshift mutation is indicated by the red lines. (I) Normalized counts of pheta1 and pheta2 transcripts. (J,K) RT-PCR amplification of pheta1 (J) and pheta2 (K) complementary DNA (cDNA) from 4 dpf WT, pheta1−/− and pheta2−/− animals, using the primer pairs indicated in E and F. Two lanes from two separate pools of animals are shown for each genotype. No alternative splice forms were detected in the mutants. Expected sizes for pheta1: 326 bp (WT and pheta2−/−) and 288 bp (pheta1−/−). Expected sizes for pheta2: 825 bp (WT and pheta1−/−) and 814 bp (pheta2−/−).

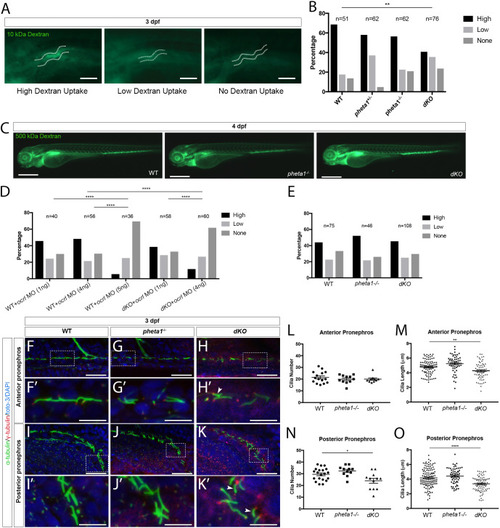
Loss of pheta1/2 disrupts fluid-phase endocytosis and ciliogenesis in the pronephros. (A,B) Pronephros uptake of Alexa Fluor 488-10 kDa dextran in 3 dpf larvae. (A) Animals were categorized as having high, low or no uptake (WT images are shown). The pronephric tubules are indicated by white dashed lines. Scale bars: 100 µm. (B) Comparison of 10 kDa dextran uptake between genotypes. (C) Representative images of animals injected with 500 kDa dextran. Scale bars: 200 µm. (D) WT and dKO animals injected with ocrl MO at the one-cell stage, then 10 kDa dextran at 3 dpf. (E) Pronephros uptake of RAP-Cy3 at 3 dpf. (F-K′) Representative confocal images of cilia in the pronephros of WT, pheta1−/− and dKO animals. Cilia were labeled with anti-acetylated α-tubulin (green), basal bodies were labeled with anti-γ tubulin (red), and nuclei were labeled with toto-3 or DAPI (blue). Scale bars: 25 µm. Areas within the white dashed boxes in F,G,H,I,J,K are magnified in F′,G′,H′,I′,J′,K′. Arrowheads indicate examples of shorter cilia in dKO animals. Scale bars: 10 µm. (L-O) Quantification of cilia morphology in 3 dpf larvae. Graphs show the cilia number (L) and length (M) in the anterior pronephros, and the cilia number (N) and length (O) in the posterior pronephros. Five cilia were selected from each animal for cilia length measurements. Error=s.e.m. *P<0.05, **P<0.01, ****P<0.0001.

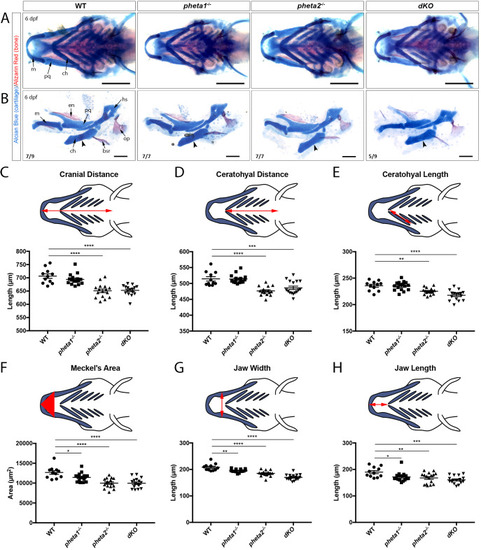
Loss of pheta1/2 disrupts craniofacial development. (A,B) Alcian Blue and Alizarin Red staining in 6 dpf animals. Structures are as indicated in the leftmost images. (A) Ventral view of the lower jaw. Representative images from each genotype are shown. Images are quantified in panels C-H. Scale bars: 200 µm. (B) Flat-mount preparations of the lower jaw at 6 dpf. Arrowheads point to where osteogenesis occurs within the ceratohyal cartilage. The number of animals imaged with displayed phenotype is shown in the lower-left corner of each image. Scale bars: 100 µm. (C-H) Morphological measurements of 6 dpf larvae, with the measured distance/area highlighted in red in the above schematics. bsr, brachiostegal ray; ch, ceratohyal; en, entopterygoids; hs, hyosymplectic; m, Meckel's cartilage; op, opercle; pq, palatoquadrate. *P<0.05, **P<0.01, ***P<0.001, ****P<0.0001.

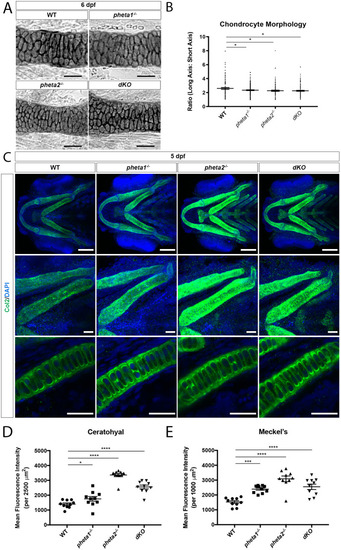
Loss of pheta1/2 disrupts chondrocyte maturation. (A) Ceratohyal cartilage, stained with Alcian Blue in flat-mount preparation. Scale bars: 50 µm. (B) Chondrocyte morphology analysis in ceratohyal cartilage (within a 200 µm2 area). (C) Top row: Z-projection ventral view of larvae immunostained for Col2 (green). Nuclei are labeled with DAPI (blue). Scale bars: 100 μm. Middle row: higher-magnification Z-projection images of corresponding ceratohyal cartilage. Scale bars: 25 μm. Bottom row: higher-magnification single optical section images of corresponding ceratohyal cartilage, depicting extracellular secretion of type II collagen. Scale bars: 25 µm. (D,E) Quantification of mean fluorescence intensity in the ceratohyal (D) and Meckel's cartilage (E) in 5 dpf larvae. *P<0.05, ***P<0.001, ****P<0.0001.

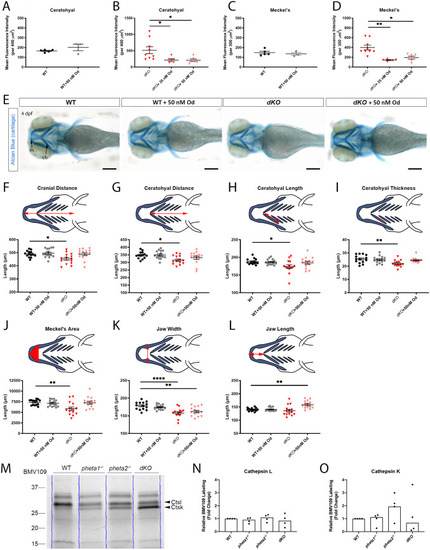
Craniofacial deficits are rescued by Od-mediated inhibition of cathepsin K. (A-D) Mean fluorescence intensity of Col2 immunostaining in the ceratohyal (WT in A, dKO in B) and Meckel's cartilage (WT in C, dKO in D) of 4 dpf larvae with and without Od treatment. (E) Representative images of larvae stained with Alcian Blue. Scale bars: 200 µm. (F-L) Craniofacial morphological measurements at 4 dpf. The measured parameters are highlighted in red in the schematics. (M) In-gel analyses of BMV109, showing cathepsin activities in WT and pheta1/2 mutants at 4 dpf. Blue lines indicate the lane boundaries. (N,O) Quantitation of the cathepsin K and cathepsin L bands from four experiments. Error=s.e.m. ch, ceratohyal; Ctsk, cathepsin K; Ctsl, cathepsin L; m, Meckel's cartilage. *P<0.05, **P<0.01, ****P<0.0001.

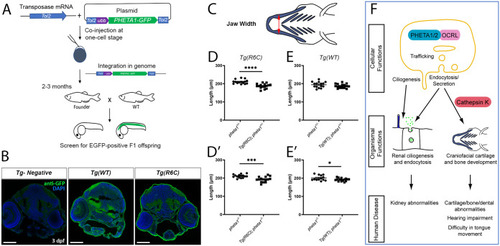
Pheta1R6C exerts a dominant-negative effect on craniofacial development in the partial or complete absence of Pheta1. (A) Outline of the procedures for generating the Tg(R6C) and Tg(WT) transgenic lines. (B) Confocal images showing broad expression of Pheta1WT-GFP and Pheta1R6C-GFP larvae in transverse cryosections, stained with anti-GFP (green) and DAPI (blue). A control larva with no transgene expression (Tg-Negative) is shown for comparison. Scale bars: 100 μm. (C-E′) Craniofacial measurements of 6 dpf larvae, with schematics shown in C. (D,E) Jaw width of pheta1+/– animals with and without Tg(R6C) (D) and Tg(WT) (E) transgenes. (D′,E′) Jaw width of pheta1−/− animals with and without Tg(R6C) (D′) and Tg(WT) (E′) transgenes. *P<0.05, ***P<0.001, ****P<0.0001. (F) Summary model. At the subcellular level, PHETA1/2 is known to interact with OCRL to regulate intracellular trafficking, ciliogenesis, endocytosis and secretion. These cellular functions likely enable PHETA1/2 to facilitate renal and craniofacial development, with the latter further requiring cathepsin K regulation. In humans, a deficiency in PHETA1 function potentially leads to abnormal development of the kidney and craniofacial structures. Other functional impairments such as hearing and tongue movement may also be associated with abnormal cartilage or bone formation.

Acknowledgments
This image is the copyrighted work of the attributed author or publisher, and ZFIN has permission only to display this image to its users. Additional permissions should be obtained from the applicable author or publisher of the image. Full text @ Dis. Model. Mech.