IMAGE

Fig. 3.

ID
ZDB-IMAGE-200608-18
Antibodies
Source
Figures for Ates et al., 2020
Image
Figure Caption

Fig. 3.

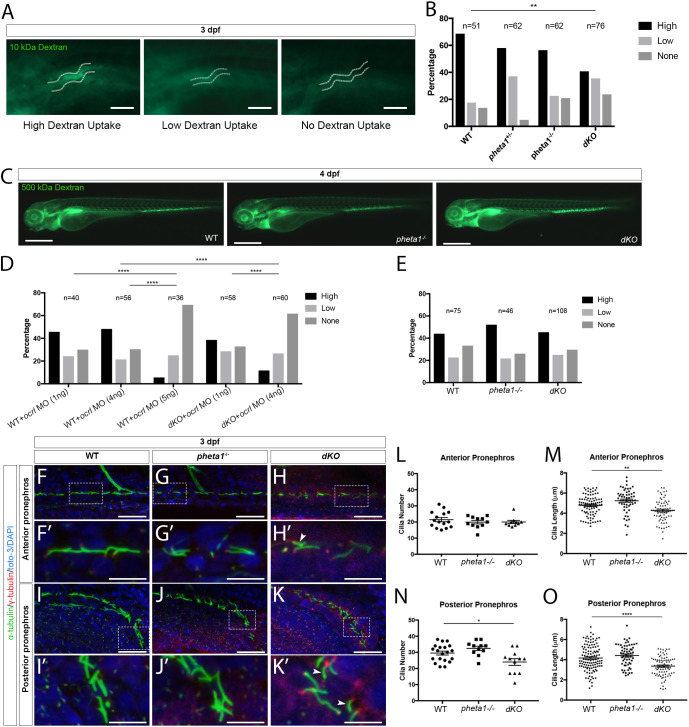
Loss of pheta1/2 disrupts fluid-phase endocytosis and ciliogenesis in the pronephros. (A,B) Pronephros uptake of Alexa Fluor 488-10 kDa dextran in 3 dpf larvae. (A) Animals were categorized as having high, low or no uptake (WT images are shown). The pronephric tubules are indicated by white dashed lines. Scale bars: 100 µm. (B) Comparison of 10 kDa dextran uptake between genotypes. (C) Representative images of animals injected with 500 kDa dextran. Scale bars: 200 µm. (D) WT and dKO animals injected with ocrl MO at the one-cell stage, then 10 kDa dextran at 3 dpf. (E) Pronephros uptake of RAP-Cy3 at 3 dpf. (F-K′) Representative confocal images of cilia in the pronephros of WT, pheta1−/− and dKO animals. Cilia were labeled with anti-acetylated α-tubulin (green), basal bodies were labeled with anti-γ tubulin (red), and nuclei were labeled with toto-3 or DAPI (blue). Scale bars: 25 µm. Areas within the white dashed boxes in F,G,H,I,J,K are magnified in F′,G′,H′,I′,J′,K′. Arrowheads indicate examples of shorter cilia in dKO animals. Scale bars: 10 µm. (L-O) Quantification of cilia morphology in 3 dpf larvae. Graphs show the cilia number (L) and length (M) in the anterior pronephros, and the cilia number (N) and length (O) in the posterior pronephros. Five cilia were selected from each animal for cilia length measurements. Error=s.e.m. *P<0.05, **P<0.01, ****P<0.0001.

Figure Data
Acknowledgments
This image is the copyrighted work of the attributed author or publisher, and ZFIN has permission only to display this image to its users. Additional permissions should be obtained from the applicable author or publisher of the image. Full text @ Dis. Model. Mech.