IMAGE

Fig. 4.

ID
ZDB-IMAGE-200608-19
Source
Figures for Ates et al., 2020
Image
Figure Caption

Fig. 4.

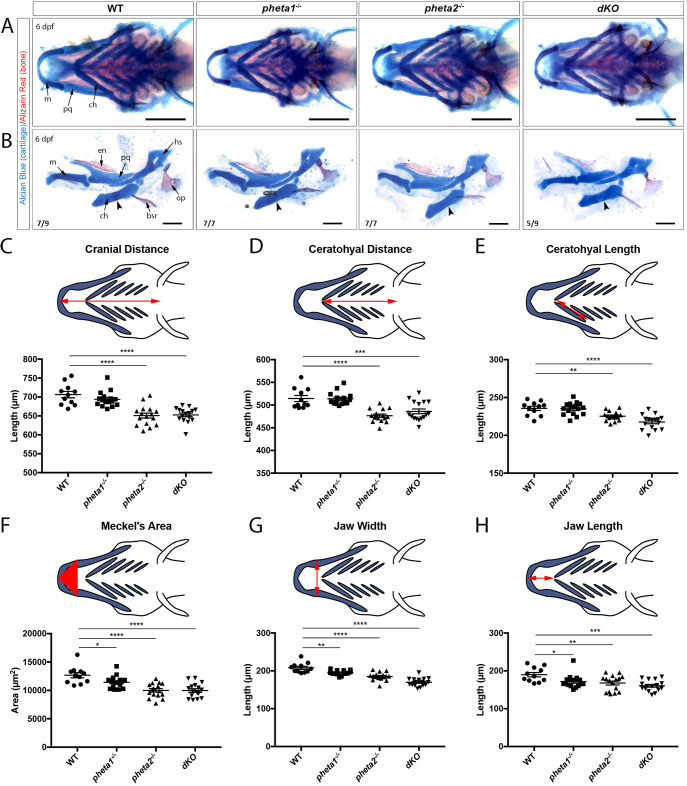
Loss of pheta1/2 disrupts craniofacial development. (A,B) Alcian Blue and Alizarin Red staining in 6 dpf animals. Structures are as indicated in the leftmost images. (A) Ventral view of the lower jaw. Representative images from each genotype are shown. Images are quantified in panels C-H. Scale bars: 200 µm. (B) Flat-mount preparations of the lower jaw at 6 dpf. Arrowheads point to where osteogenesis occurs within the ceratohyal cartilage. The number of animals imaged with displayed phenotype is shown in the lower-left corner of each image. Scale bars: 100 µm. (C-H) Morphological measurements of 6 dpf larvae, with the measured distance/area highlighted in red in the above schematics. bsr, brachiostegal ray; ch, ceratohyal; en, entopterygoids; hs, hyosymplectic; m, Meckel's cartilage; op, opercle; pq, palatoquadrate. *P<0.05, **P<0.01, ***P<0.001, ****P<0.0001.

Figure Data
Acknowledgments
This image is the copyrighted work of the attributed author or publisher, and ZFIN has permission only to display this image to its users. Additional permissions should be obtained from the applicable author or publisher of the image. Full text @ Dis. Model. Mech.