
- Title
-
The interplay of atoh1 genes in the lower rhombic lip during hindbrain morphogenesis
- Authors
- Belzunce, I., Belmonte-Mateos, C., Pujades, C.
- Source
- Full text @ PLoS One
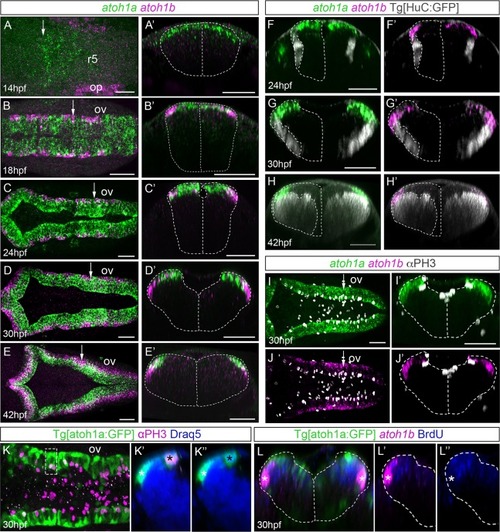
A-E) Whole mount double EXPRESSION / LABELING:
|
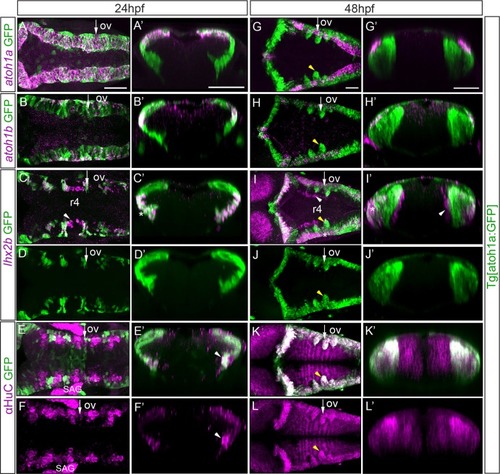
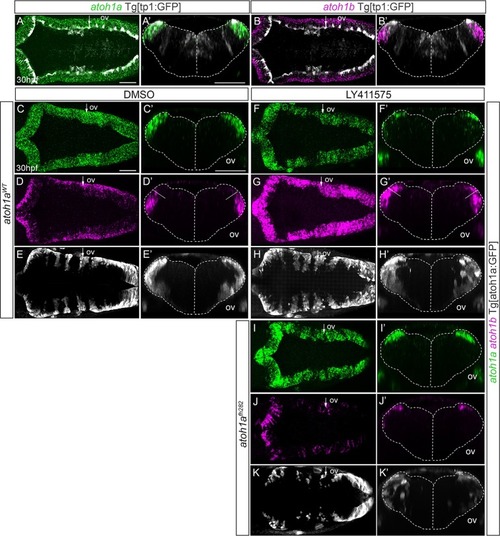
Tg[atoh1a:GFP] embryos at 24hpf and at 48hpf were assayed for |
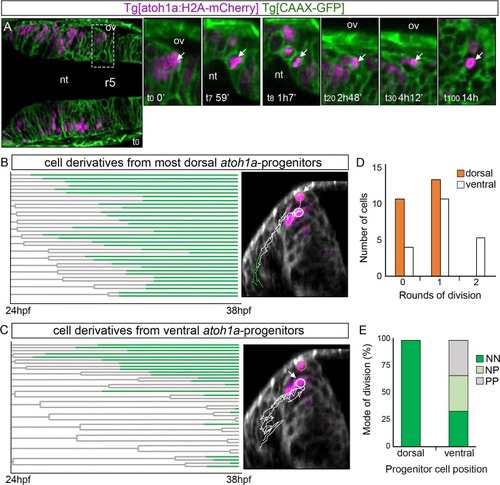
Tg[atoh1a:H2A-mCherry] Tg[CAAX:GFP] embryos were imaged from 24hpf during 14h, and information about cell position was acquired every 7min. A) Dorsal view of an embryonic hindbrain displaying |
A-L) |

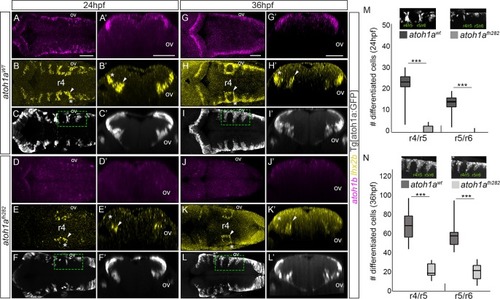
A-B) Box-plots with the quantification of mitotic figures within the LRL atoh1a:GFP cells (A), and the total number of LRL atoh1a:GFP cells (B), in |
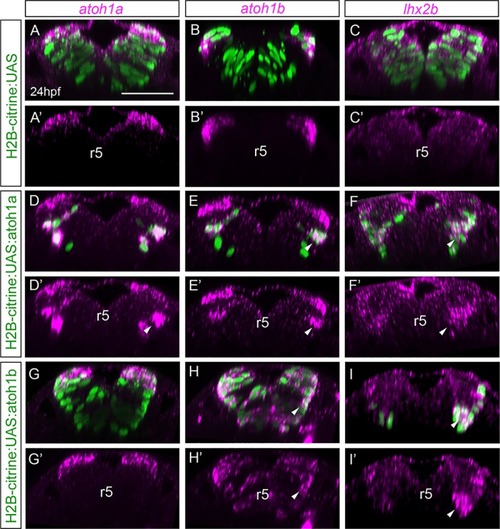
Mu4127 embryos expressing Gal4 in rhombomeres 3 and 5 were injected with H2B-citrine:UAS (A-C), H2B-citrine:UAS:atoh1a (D-F) or H2B-citrine:UAS:atoh1b (G-I) constructs in order to ectopically express the gene of interest in r3 and r5. Injected embryos were assayed for Citrine expression (green) and |
A-B) Whole mount double |

ZFIN is incorporating published figure images and captions as part of an ongoing project. Figures from some publications have not yet been curated, or are not available for display because of copyright restrictions. EXPRESSION / LABELING:
|