|
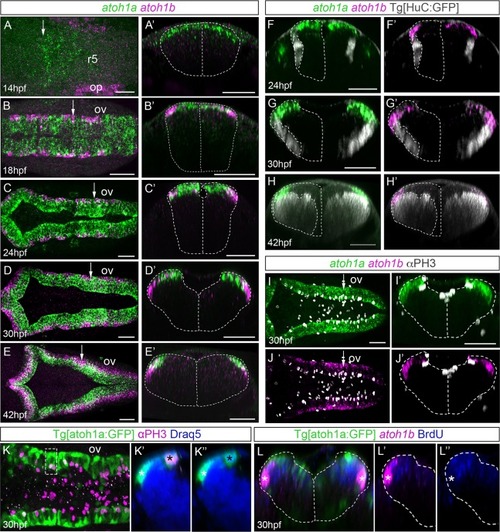
Spatiotemporal analysis of <italic>atoh1a</italic> and <italic>atoh1b</italic> within the hindbrain.A-E) Whole mount double in situ hybridization with atoh1a (green) and atoh1b (magenta) in wild type embryos from 14hpf to 42hpf. Dorsal views with anterior to the left. A’-E’) Reconstructed transverse views of dorsal views in (A-E) at the level indicated by the white arrow depicted in (A-E). Note that the expression of atoh1b is more lateral than atoh1a-cells. Dotted line corresponded to the neural tube contour. F-H) Whole mount double in situ hybridization with atoh1a (green) and atoh1b (magenta) on Tg[HuC:GFP] embryos from 24hpf to 42hpf, where HuC expression was displayed in white. Dotted line corresponded to the neural tube and the HuC-expression contours (only half of it). I-J) Embryos at 30hpf were double in situ hybridized with atoh1a (green) and atoh1b (magenta) and cell proliferation was assessed by anti-PH3 staining (white). Dorsal views with anterior to the left. I’-J’) Reconstructed transverse views of (I-J) at the level pointed by the white arrow in (I-J). Note atoh1a-cells underwent mitosis, whereas fewer atoh1b-cells did. Dotted line corresponded to the neural tube contour. K-K”) Tg[atoh1a:GFP] embryo after anti-PH3 (magenta) and DAPI (blue) staining. K’-K”) Reconstructed transverse views of the region framed in (K), which is a dorsal view with anterior to the left. This is an example of an apical atoh1a:GFP cell undergoing division (black asterisk) and lateral atoh1a:GFP cell that did not (white asterisk), with (K’) or without (K”) the red-PH3 staining. Note that atoh1a:GFP cell nuclei expressing PH3 are located in the apical region (black asterisks), whereas atoh1a:GFP cell nuclei negative for PH3 (most probably atoh1b-positive, white asterisk) are in the most lateral domain. L-L”) Tg[atoh1a:GFP] embryo incubated for 30min with BrdU (blue) and assayed for atoh1b in situ hybridization (magenta). Reconstructed transverse views with (L-L’) or without (L”) atoh1b-staining. White asterisks indicate atoh1b cells that did not incorporate BrdU. Dotted line corresponded to the neural tube contour. op, otic placode; ov, otic vesicle; r, rhombomere. Scale bars correspond to 50 μm.
|