FIGURE SUMMARY
Title

Exploring the potential of BH3 mimetic therapy in squamous cell carcinoma of the head and neck

Authors
Carter, R.J., Milani, M., Butterworth, M., Alotibi, A., Harper, N., Yedida, G., Greaves, G., Al-Zebeeby, A., Jorgensen, A.L., Schache, A.G., Risk, J.M., Shaw, R.J., Jones, T.M., Sacco, J.J., Hurlstone, A., Cohen, G.M., Varadarajan, S.
Source
Full text @ Cell Death Dis.

BCL-X<sub>L</sub> and MCL-1 but not BCL-2 are highly expressed in SCCHN cell lines and oral cavity tissue microarrays from SCCHN patients.

a Western blot analysis of the three major anti-apoptotic BCL-2 family proteins in SCCHN cell lines. Sites of primary tumors are indicated in brackets: OC oral cavity, LX larynx, OP oropharynx. b BH3 profiling with increasing concentrations of BIM peptide revealed that the indicated SCCHN cell lines were primed to undergo apoptosis. c SCCHN cell lines exposed to the indicated BH3 mimetics (100 nM) for 24 h failed to undergo apoptosis, as assessed by phosphatidylserine (PS) externalization. df Representative IHC images of oral cavity (OC) normal tissue, primary tumor core and advancing front (AF), stained using antibodies against d BCL-2 e BCL-XL, and f MCL-1 (clone D5V5L) and counterstained with hematoxylin. Scale bars 50 μm. Dot plots depict the relative staining intensities (H-scores) of the specified antibody. Each dot represents the data from an individual patient. The IHC images shown correspond to the yellow circles in the graph. b, c One-way ANOVAs with Dunnett’s multiple comparisons tests, with a single pooled variance. Error bars = mean ± SEM of at least three independent experiments. df Normality tests were performed, followed by Kruskal Wallis tests with Dunn’s multiple comparisons tests. Error bars = mean ± SD. *P < 0.05, **P < 0.01, ***P < 0.001.

BCL-X<sub>L</sub> and MCL-1 but not BCL-2 are highly expressed in hypopharynx and larynx tissue microarrays from SCCHN patients.

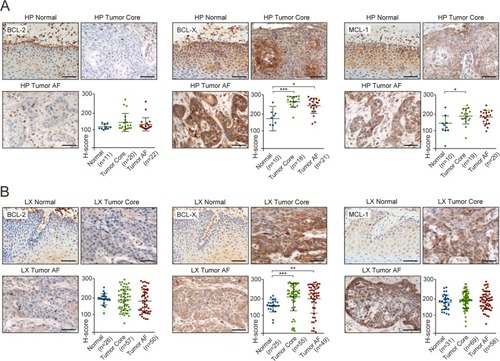
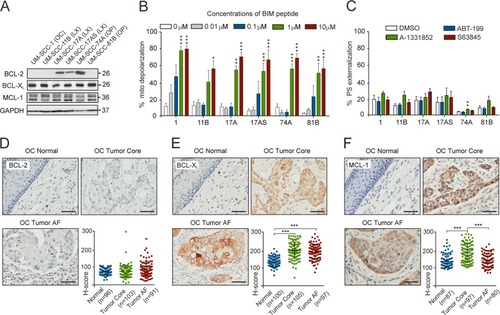
Representative IHC images of normal tissue, primary tumor core and advancing front (AF) from a hypopharynx (HP) and b larynx (LX) stained against the indicated antibodies and counterstained with hematoxylin. Scale bars 50 μm. The plots depict the relative staining intensities (H-score) of the specified antibody. Each dot represents the data from an individual patient. The IHC images shown correspond to the yellow dots in the graph. Normality tests were performed, followed by Kruskal Wallis tests with Dunn’s multiple comparisons tests. Error bars = mean ± SD. *P < 0.05, **P < 0.01, ***P < 0.001.

Expression levels of the antiapoptotic BCL-2 family members do not correlate with patient overall survival.

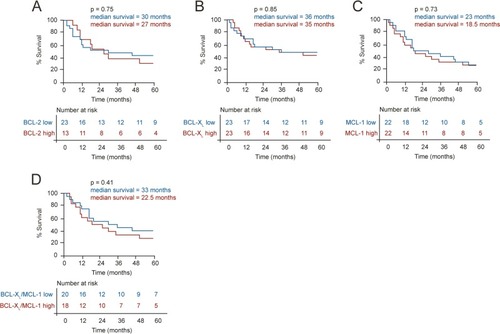
Kaplan–Meier curves comparing the overall survival of patients (censored at 60 months) in the highest versus lowest quartiles for expression of a BCL-2, b BCL-XL, c MCL-1, and d BCL-XL and MCL-1, in oral cavity tumors. Numbers at risk are displayed below each graph, to demonstrate the numbers of patients analyzed per category. Comparison of survival curves used the log-rank (Mantel–Cox) test.

Inhibition of both MCL-1 and BCL-X<sub>L</sub> induces apoptosis in SCCHN cell lines and primary cells.

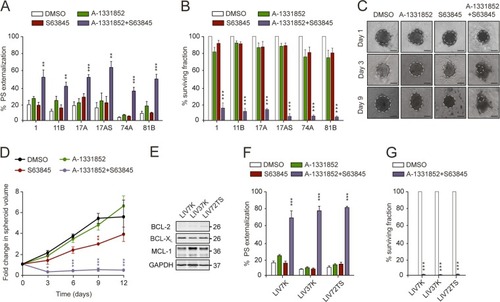
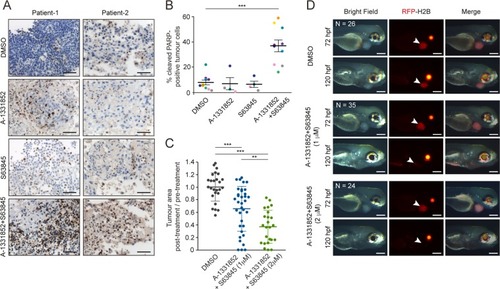
SCCHN cell lines exposed to a combination of A-1331852 and S63845 (100 nM each) for 24 h exhibited a enhanced apoptosis and b decreased clonogenicity, compared to the individual BH3 mimetics. c Phase contrast images (scale bars 100 μm), and d line graph to show fold change in spheroid volume over 12 days, following exposure to the specified drug(s). Dotted lines in c demarcate the outline of each intact spheroid. e Western blot analysis of antiapoptotic protein levels in SCCHN primary cells. These cells, exposed to a combination of A-1331852 and S63845 (100 nM) for 4 h exhibited f enhanced apoptosis and g decreased clonogenicity, compared to the indicated treatments. a, b, f One-way ANOVAs with Dunnett’s multiple comparisons tests, with a single pooled variance; d two-way repeated measures ANOVA with Dunnett’s multiple comparisons test; g unpaired, two-tailed t tests. Error bars = mean ± SEM of at least three independent experiments. *P < 0.05, **P < 0.01, ***P < 0.001.

A combination of A-1331852 and S63845 induces apoptosis in SCCHN patient explants and reduces tumor burden in zebrafish xenografts.

a Representative IHC images from two patients (scale bars 50 μm) and b quantitation of cleaved PARP staining in SCCHN explants from up to 10 patients treated for 48 h, as indicated. Each point in the dot plot represents one patient. Approximately, 1000–2000 cells were counted per patient, per treatment. One-way ANOVA with Dunnett’s multiple comparisons test. Error bars = mean ± SEM. ***P < 0.001. c Dot plots (each point represents one zebrafish) show the size of each post-treatment xenograft at 120 hpf, normalized to the mean of the DMSO-treated (control) group. One-way ANOVA with Tukey’s multiple comparisons test. Error bars = mean ± SD. **P < 0.01, ***P < 0.001. d Representative images (scale bars 200 μm) of zebrafish containing xenografts of UM-SCC-81B cells expressing H2B-mRFP. Arrowheads indicate the tumor cells and the effects of the treatments. Pre-treatment images are labeled 72 hpf, and images acquired following 48 h exposure to the specified drugs are labeled 120 hpf. The red fluorescence observed in the eyes is a result of a red lens reporter in the ubiq:secAnnexinV-mVenus fish.

Acknowledgments
This image is the copyrighted work of the attributed author or publisher, and ZFIN has permission only to display this image to its users. Additional permissions should be obtained from the applicable author or publisher of the image. Full text @ Cell Death Dis.