
FIGURE
Fig. 3
- ID
- ZDB-FIG-191230-1437
- Publication
- Carter et al., 2019 - Exploring the potential of BH3 mimetic therapy in squamous cell carcinoma of the head and neck
- Other Figures
- All Figure Page
- Back to All Figure Page
Fig. 3
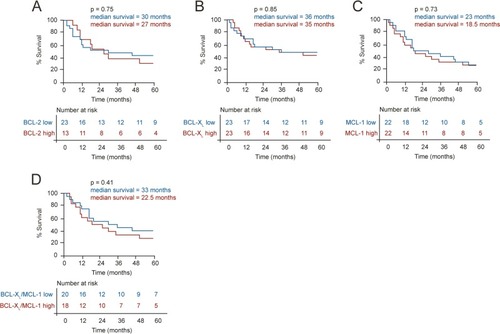
Kaplan–Meier curves comparing the overall survival of patients (censored at 60 months) in the highest versus lowest quartiles for expression of |
Expression Data
Expression Detail
Antibody Labeling
Phenotype Data
Phenotype Detail
Acknowledgments
This image is the copyrighted work of the attributed author or publisher, and
ZFIN has permission only to display this image to its users.
Additional permissions should be obtained from the applicable author or publisher of the image.
Full text @ Cell Death Dis.