|
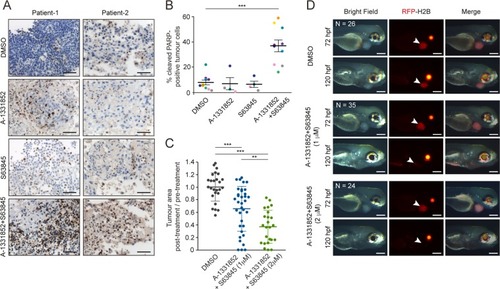
A combination of A-1331852 and S63845 induces apoptosis in SCCHN patient explants and reduces tumor burden in zebrafish xenografts.a Representative IHC images from two patients (scale bars 50 μm) and b quantitation of cleaved PARP staining in SCCHN explants from up to 10 patients treated for 48 h, as indicated. Each point in the dot plot represents one patient. Approximately, 1000–2000 cells were counted per patient, per treatment. One-way ANOVA with Dunnett’s multiple comparisons test. Error bars = mean ± SEM. ***P < 0.001. c Dot plots (each point represents one zebrafish) show the size of each post-treatment xenograft at 120 hpf, normalized to the mean of the DMSO-treated (control) group. One-way ANOVA with Tukey’s multiple comparisons test. Error bars = mean ± SD. **P < 0.01, ***P < 0.001. d Representative images (scale bars 200 μm) of zebrafish containing xenografts of UM-SCC-81B cells expressing H2B-mRFP. Arrowheads indicate the tumor cells and the effects of the treatments. Pre-treatment images are labeled 72 hpf, and images acquired following 48 h exposure to the specified drugs are labeled 120 hpf. The red fluorescence observed in the eyes is a result of a red lens reporter in the ubiq:secAnnexinV-mVenus fish.
|