- Title
-
Two adhesive systems cooperatively regulate axon ensheathment and myelin growth in the CNS
- Authors
- Djannatian, M., Timmler, S., Arends, M., Luckner, M., Weil, M.T., Alexopoulos, I., Snaidero, N., Schmid, B., Misgeld, T., Möbius, W., Schifferer, M., Peles, E., Simons, M.
- Source
- Full text @ Nat. Commun.
|
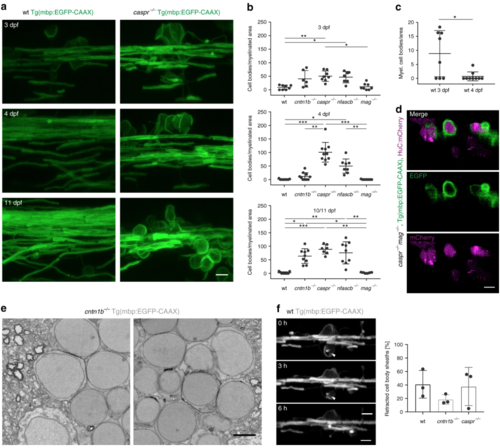
Loss of adhesion molecules of the paranodal axo-glial junction results in neuronal cell body wrapping. a CNS myelin of 3, 4 and 10 dpf wild-type (wt) and caspr−/− fish. Note cell body wrappings in caspr−/− fish. b Cell body wrappings per myelinated area at 3, 4, and 10/11 dpf ( n = 6–10, Kruskal Wallis ANOVA: 3 dpf: p = 0.0004, 4 dpf and 10/11 dpf: p < 0.0001). c Cell body wrappings in wt fish ( n = 8–9). Data derived from panel ( b). Mann-Whitney test, * p = 0.0399. d HuC:mCherry expression in 4 dpf caspr−/− mag−/− fish shows neuronal cell bodies enwrapped by myelin membrane. e SEM images of cell body wrappings in cntn1b−/− fish at dpf 10. f Sheath retractions (arrow) from neuronal cell bodies (30 min intervals, 15–16 h time lapse experiments, n = 3, Kruskal-Wallis one-way ANOVA: p = 0.4393). Images ( a, d, f) are maximum intensity projections of Tg(mbp:EGFP-CAAX) zebrafish dorsal spinal cord. p values, * < 0.05, ** < 0.01, *** < 0.001. Data are presented as means ± s.d.Scale bars, 5 mm ( a, d, f), 2 µm ( e). Source data are provided as a Source Data file EXPRESSION / LABELING:
PHENOTYPE:
|
|
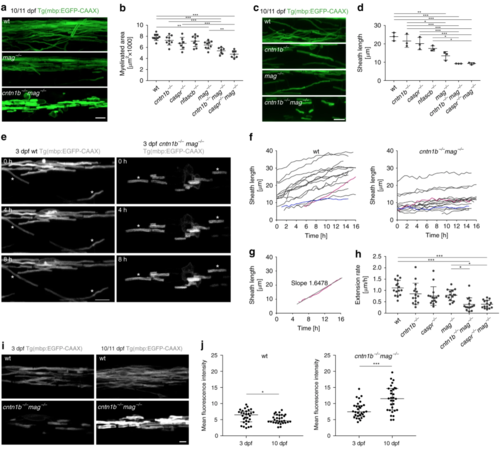
Mag and adhesion molecules of the paranodal axo-glial junction regulate myelin growth in zebrafish. a CNS myelin of 10/11dpf wild-type (wt), mag−/− and cntn1b−/− mag−/− fish. b Myelinated area at 10/11 dpf ( n = 7–9; one-way ANOVA: p < 0.0001). c Representative wt and mutant myelin sheaths at 10/11 dpf. d Sheath length at 10/11 dpf (means of 60 sheaths per animal, n = 3, one-way ANOVA, p < 0.0001). e– h Myelin sheath extension at 3 dpf (30 min interval, 15–16 h time lapse experiments). Asterisks in panel ( e) represent extending sheaths. Sheath length over time is shown in panel ( f) (15 sheaths from 3 animals). The fastest (magenta) and slowest (blue) extending sheath are highlighted. Extension rates ( h) were calculated from ( f) according to panel ( g). One-way ANOVA: p < 0.0001. i Myelin sheaths of 3 dpf and 10 dpf cntn1b−/− mag−/− show differences in sheath intensity compared to wt. j Mean fluorescence intensities of 30 representative sheaths from 3 fish at 3 and 10 dpf, wt (left) and cntn1b−/− mag−/− (right). Unpaired two-sided t test: p = 0.0473 (wt), p = 0.0002 ( cntn1b−/− mag−/−). Data are presented as means ± s.d. Scale bars, 10 μm ( a, c, e), 5 μm ( i). Source data are provided as a Source Data file EXPRESSION / LABELING:
PHENOTYPE:
|
|
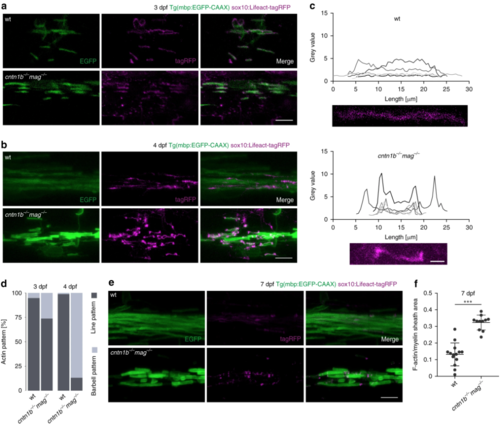
Loss of adhesion molecules results in aberrant F-Actin distribution along the myelin sheath in zebrafish. a Myelin sheaths in 3 dpf wild-type (wt) and cntn1b−/− mag−/− fish expressing Lifeact-tagRFP to label F-actin. Lifeact-tagRFP displayed a line pattern distribution in both wt and mutant. b Myelin sheaths in 4 dpf wt and cntn1b−/− mag−/− fish expressing Lifeact-tagRFP. Lifeact-tagRFP displayed a line pattern distribution in wt and a barbell pattern in mutants. cRepresentative images and quantification of Lifeact-tagRFP fluorescence intensities along example sheaths at 4 dpf. dRatio of barbell-shaped and line-shaped patterns in myelin sheaths ( n = 3–5) at 3 and 4 dpf. e Myelin sheaths in7 dpf wt and cntn1b−/− mag−/− fish expressing Lifeact-tagRFP. Lifeact-tagRFP had almost disappeared in wt, whereas the barbell pattern persisted in mutants. f Quantification of the area occupied by F-actin within myelin sheaths at 7 dpf in wt and cntn1b−/− mag−/− fish ( n = 11–14). Images ( a, b, e) are maximum intensity projections of Tg(mbp:EGFP-CAAX) zebrafish dorsal spinal cord. p values, *** < 0.001. Data are presented as means ± s.d. Scale bars, 10 μm ( a, b, e), 2 μm ( c). Source data are provided as a Source Data file EXPRESSION / LABELING:
PHENOTYPE:
|
|
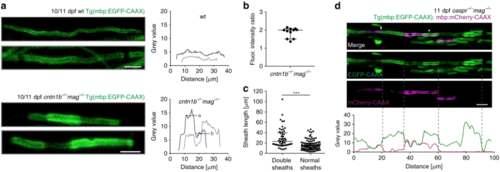
Loss of adhesive molecules results in myelin overgrowth in zebrafish. a Myelin sheaths in 10/11 dpf cntn1b−/−mag−/− fish show fluorescence intensity steps absent in wild-type fish. Fluorescence intensities along example sheaths. ‘a’ and ‘b’ represent mean fluorescence intensity levels. b Fluorescence intensity ratios (calculated ‘a’/’b’ according to panel ( a) in 11 representative cntn1b−/−mag−/− sheaths (n = 4) show two fold increase in fluorescence along the sheath in bright areas as compared to the neighboring regions. Median with interquartile range. c Length of sheaths with fluorescence intensity steps (n = 53 sheaths from 3 fish) vs. evenly labeled sheaths (n = 100 sheaths from 3 fish) in 10 dpf cntn1b−/−mag−/− fish (two-tailed Mann Whitney test, ***p < 0.0001, median with interquartile range). Sheaths were quantified from a more dorsal region compared to Fig. 2. d Expression of mbp:mCherry-CAAX in 11 dpf caspr−/−mag−/− fish reveals double myelin sheaths (asterisk) and loss of nodes of Ranvier (arrowhead). Fluorescence intensity plot along the upper myelinated axon (green = EGFP-CAAX, magenta = mCherry-CAAX). Dotted lines represent corresponding positions in image and plot. Images ( a, d) are maximum intensity projections of Tg(mbp:EGFP-CAAX) zebrafish dorsal spinal cord. Scale bars, 4 μm ( a), 10 μm ( d). Source data are provided as a Source Data file |
|
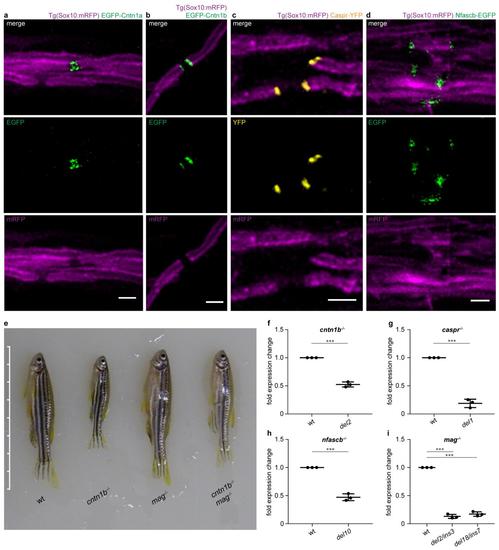
a-d Co-expression of UAS-driven fusion proteins with HuC:Gal4 (for neuronal expression) or Sox10:Gal4 (for glial expression) reveals nodal expression of EGFP-Cntn1a (a, 4 dpf) and paranodal expression of EGFP-Cntn1b (b, 7 dpf), Caspr-YFP (c, 5 dpf) and Nfascb-EGFP (d, 3 3 dpf) in Tg(Sox10:mRFP) dorsal spinal cord axons. e Phenotypes of adult wild-type (wt) and mutant zebrafish (90 dpf). Scale bar ticks represent 0.5 cm. f-i Validation of zebrafish mutant lines by quantitative PCR using the Ct method. Graphs represent fold expression change of mutant fish compared to age-matched wt fish. cntn1b-/- del2 (f, n = 3 fish, unpaired two sided t test), caspr-/- del1 (g, n = 3, unpaired two sided t test), nfascb-/- del10 (h, n = 3, unpaired two sided t test), mag-/- del2/ins3 and mag-/- del18/ins7 (i , n = 3, one-way ANOVA, p < 0.0001). Bonferroni-corrected p values: ***p < 0.001. Data are presented as means ± s.d. Scale bars, 2 m. Source data are provided as a Source Data file. |
|
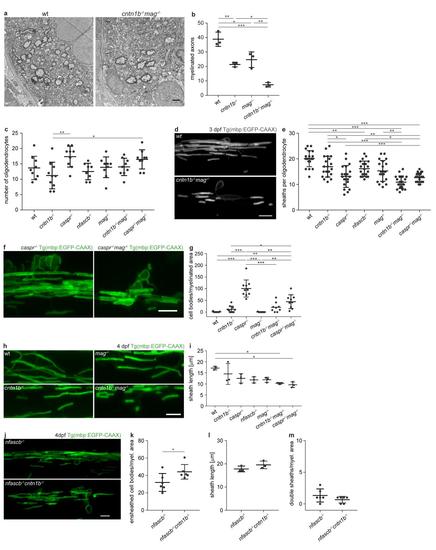
a Electron micrographs reperesent dorsal spinal cord cross-sections of 10 dpf wt and cntn1b-/-mag-/-zebrafish. b Total numbers of myelinated axons in electron micrographs of 10 dpf wt and mutant dorsal spinal cord cross-sections. n = 3 fish, one-way ANOVA: p < 0.0001. c Number of oligodendrocytes in 3 dpf anterior dorsal spinal cords of wt and mutant Tg(mbp:EGFP-CAAX) zebrafish larvae. n = 8-10 fish, one-way ANOVA: p < 0.0049. d Myelin sheaths of single oligodendrocytes in 3 dpf wild-type (top) and cntn1b-/-mag-/- (bottom) fish. e Number of myelin sheaths per oligodendrocyte in 3 dpf wt and mutant fish. Sheaths from 20 oligodendrocytes per genotype from 5-7 fish were quantified. One-way ANOVA: p < 0.0001. f Ensheathed cell bodies in 4 dpf caspr-/- (reproduced from Fig. 1a) and caspr-/-mag-/- fish. g Ensheathed cell bodies per myelinated area at 4 dpf (n = 8-10, one-way ANOVA: p = 0.0001). Quantifications for wt and single mutants were reproduced from Fig. 1b. h Representative wild type (wt) and mutant myelin sheaths of zebrafish commissural neurons at 4 dpf. i Sheath length at 4 dpf (means of 30 sheaths per animal, n = 3, one-way ANOVA, p < 0.0001). j-m CNS myelination of 4 dpf nfascb-/-cntn1b-/- fish in comparison to nfascb-/-littermates. (j) Representative images of CNS myelin. (k) Ensheathed cell bodies per myelinated area (n = 6, unpaired two-sided t test: p = 0.0482). (l) Sheath length (means of 30 sheaths per animal, n = 3, unpaired two-sided t test, p < 0.2111). (m) Double sheaths (sheaths with fluorescence intensity steps combined with caliber changes, as depicted in Fig. 4a) normalized to myelinated area (n = 6, unpaired two-sided t test, p < 0.1877). Confocal images (d,f,h,j) are maximum intensity projections of Tg(mbp:EGFP-CAAX) zebrafish dorsal spinal cord. Bonferroni-corrected p values, *0.05, **<0.01, ***<0.001. Data are presented as means ± s.d. Scale bars, 1 μm (a), 10 μm (d,f,h,j). Source data are provided as a Source Data file. |

