
Fig. 3
- ID
- ZDB-FIG-191024-4
- Publication
- Djannatian et al., 2019 - Two adhesive systems cooperatively regulate axon ensheathment and myelin growth in the CNS
- Other Figures
- All Figure Page
- Back to All Figure Page
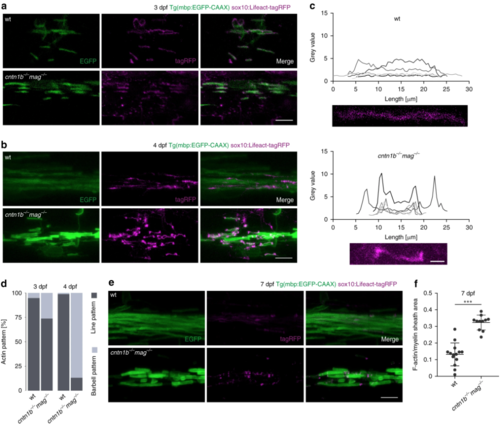
Loss of adhesion molecules results in aberrant F-Actin distribution along the myelin sheath in zebrafish. a Myelin sheaths in 3 dpf wild-type (wt) and cntn1b−/− mag−/− fish expressing Lifeact-tagRFP to label F-actin. Lifeact-tagRFP displayed a line pattern distribution in both wt and mutant. b Myelin sheaths in 4 dpf wt and cntn1b−/− mag−/− fish expressing Lifeact-tagRFP. Lifeact-tagRFP displayed a line pattern distribution in wt and a barbell pattern in mutants. cRepresentative images and quantification of Lifeact-tagRFP fluorescence intensities along example sheaths at 4 dpf. dRatio of barbell-shaped and line-shaped patterns in myelin sheaths ( n = 3–5) at 3 and 4 dpf. e Myelin sheaths in7 dpf wt and cntn1b−/− mag−/− fish expressing Lifeact-tagRFP. Lifeact-tagRFP had almost disappeared in wt, whereas the barbell pattern persisted in mutants. f Quantification of the area occupied by F-actin within myelin sheaths at 7 dpf in wt and cntn1b−/− mag−/− fish ( n = 11–14). Images ( a, b, e) are maximum intensity projections of Tg(mbp:EGFP-CAAX) zebrafish dorsal spinal cord. p values, *** < 0.001. Data are presented as means ± s.d. Scale bars, 10 μm ( a, b, e), 2 μm ( c). Source data are provided as a Source Data file |
| Gene: | |
|---|---|
| Fish: | |
| Anatomical Term: | |
| Stage Range: | Protruding-mouth to Days 7-13 |
| Fish: | |
|---|---|
| Observed In: | |
| Stage Range: | Protruding-mouth to Days 7-13 |