
|
Fig. 2
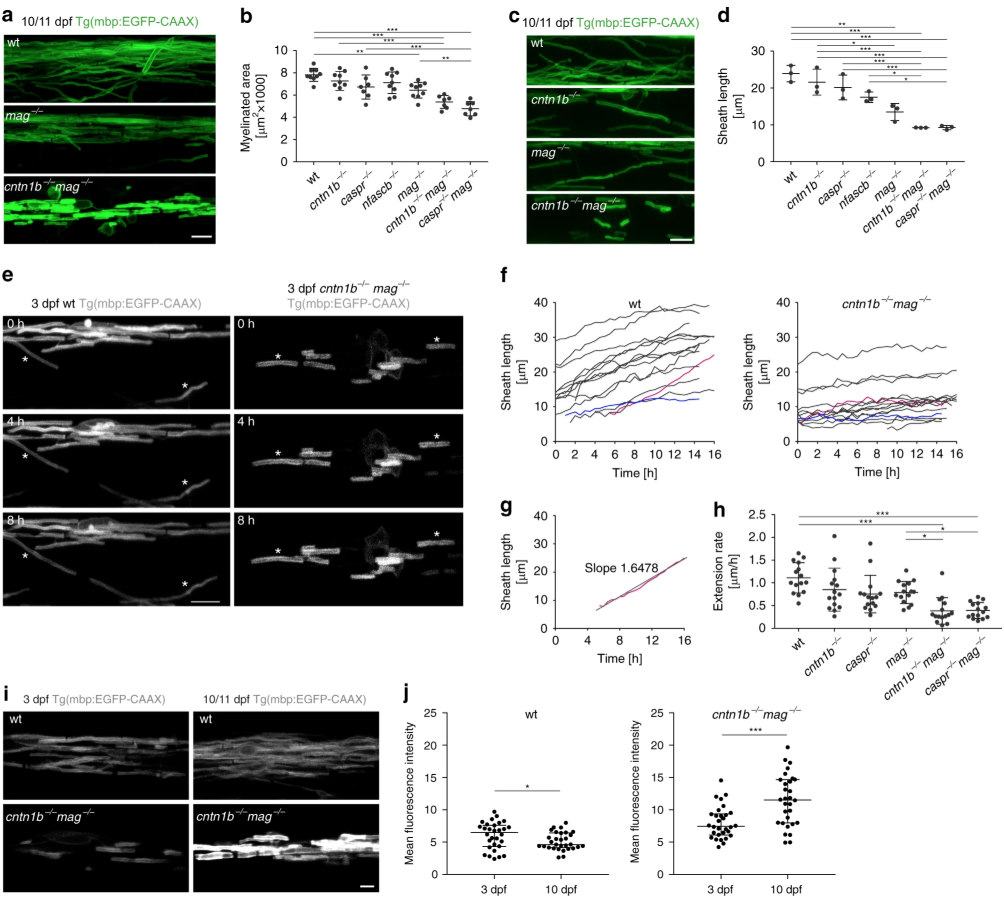
Mag and adhesion molecules of the paranodal axo-glial junction regulate myelin growth in zebrafish. a CNS myelin of 10/11dpf wild-type (wt), mag−/− and cntn1b−/− mag−/− fish. b Myelinated area at 10/11 dpf ( n = 7–9; one-way ANOVA: p < 0.0001). c Representative wt and mutant myelin sheaths at 10/11 dpf. d Sheath length at 10/11 dpf (means of 60 sheaths per animal, n = 3, one-way ANOVA, p < 0.0001). e– h Myelin sheath extension at 3 dpf (30 min interval, 15–16 h time lapse experiments). Asterisks in panel ( e) represent extending sheaths. Sheath length over time is shown in panel ( f) (15 sheaths from 3 animals). The fastest (magenta) and slowest (blue) extending sheath are highlighted. Extension rates ( h) were calculated from ( f) according to panel ( g). One-way ANOVA: p < 0.0001. i Myelin sheaths of 3 dpf and 10 dpf cntn1b−/− mag−/− show differences in sheath intensity compared to wt. j Mean fluorescence intensities of 30 representative sheaths from 3 fish at 3 and 10 dpf, wt (left) and cntn1b−/− mag−/− (right). Unpaired two-sided t test: p = 0.0473 (wt), p = 0.0002 ( cntn1b−/− mag−/−). Data are presented as means ± s.d. Scale bars, 10 μm ( a, c, e), 5 μm ( i). Source data are provided as a Source Data file