FIGURE SUMMARY
Title

Preservation of zebrafish genetic resources through testis cryopreservation and spermatogonia transplantation

Authors
Marinović, Z., Li, Q., Lujić, J., Iwasaki, Y., Csenki, Z., Urbányi, B., Yoshizaki, G., Horváth, Á.
Source
Full text @ Sci. Rep.

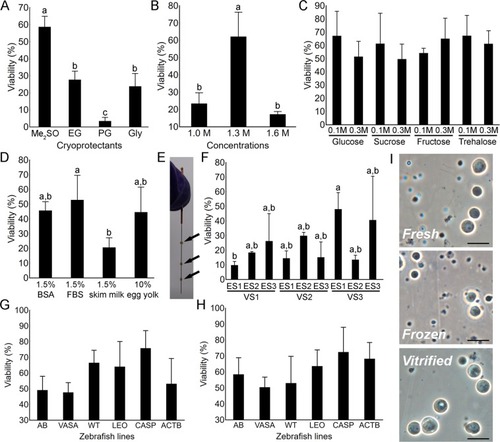
Optimization of the slow-rate freezing (AD) and vitrification (F) protocols. (A) Viability of spermatogonia after freezing with 1.3 M dimethyl sulfoxide (Me2SO), ethylene glycol (EG), propylene glycol (PG) and glycerol (Gly) (N = 3). (B) Viability of spermatogonia after slow-rate freezing with either 1.0, 1.3 or 1.6 M of Me2SO (N = 3). The effects of sugar (C) and protein (D) supplementation of spermatogonia viability (N = 3). (E) Testes (arrows) pinned on an acupuncture needle for the needle-immersed vitrification (NIV) method. (F) The effects of different equilibration (ES) and vitrification (VS) solutions on spermatogonia viability after NIV (N = 3). Reproducibility of the developed freezing (G) and vitrification protocols (H) demonstrated on AB wild-type (AB), vasa (ddx4sa6158/sa6158; VASA), Wilms tumor (wt1b; WT), leopard (gja5bt1; LEO), casper (mitfaw2/w2; mpv17a9/a9; CASP) and β-actin (pku341Tg; ACTB) zebrafish lines. (I) Testicular cell suspensions prior to, and after cryopreservation. All values are presented as mean ± SD. Different letters above the SD bars indicate statistical significance (Tukey’s HSD, p < 0.05). Scale bars: (I) 20 µm.

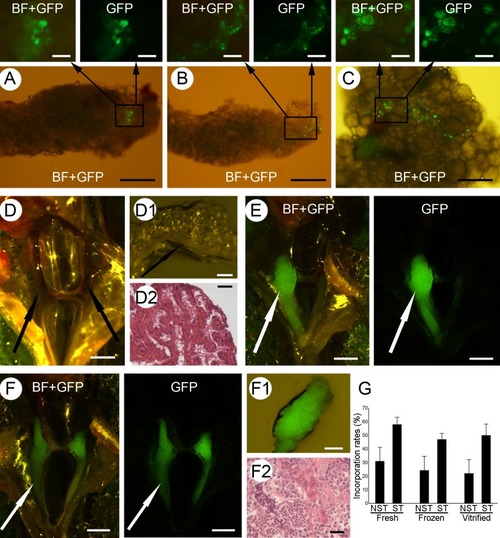
Incorporation and proliferation of fresh and cryopreserved spermatogonia. The incorporation and proliferation of fresh (A) and cryopreserved (B,C) vasa::egfp spermatogonia within the testes (A,B) and ovaries (C) of non-sterilized recipients. Testes (arrows) of the control MO-sterilized recipients (D) appear undeveloped under the stereomicroscope (D1), while the histological analysis (D2) displayed a lack of developing germ cells. Recipients of actb:yfp spermatogonia displayed either one (E) or both (F) developed testes (arrows). Developed testes displayed strong green fluorescence originating from donor actb:yfp spermatogonia (F1), while histological analyses displayed clear differentiation of germ cells into spermatozoa (F2). (G) Incorporation of fresh and cryopreserved spermatogonia into non-sterilized (NST) or MO-sterilized (ST) recipients. Values are presented as mean ± SD. Scale bars: (A, B, C) 500 µm; (top panels) 100 µm; (D, E, F) 1 mm; (D1, F1) 200 µm; (D2, F2) 20 µm.

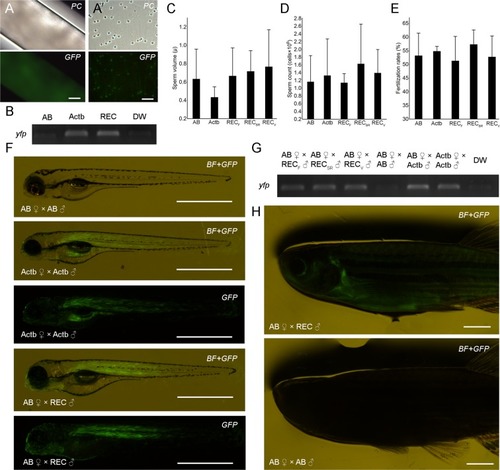
Production of donor-derived spermatozoa and progeny from MO-sterilized recipients. Milt (A) and individual spermatozoa (A’) stripped from recipients demonstrating yfp fluorescence. (B) RT-PCR amplification of yfp in milt obtained from wild-type AB (AB), β-actin transgenic (pku341Tg; Actb) and recipient (REC) zebrafish. Milt volume (C) and sperm count (D) of milt obtained from wild-type AB (AB), β-actin transgenic fish (pku341Tg; Actb) and recipients of fresh (RECF), frozen (RECSR) and vitrified (RECV) spermatogonia. (E) Fertilization rates after spawning control fish as well as recipient males and wild-type AB females. (F) Three dpf larvae obtained from crossing control fish and recipient males with wild-type AB females under fluorescent stereomicroscope. (G) PCR amplification of yfp in offspring obtained from control crossings, as well as from crossing recipient males with wild-type AB females. (H) F1 individuals developed normally and donor-derived individuals displayed fluorescent signal compared to the control crossing six months after fertilization. Values in CE are presented as mean ± SD. Lack of different letters above SD lines indicate the lack of statistical significance (Tukey’s HSD, p > 0.05). Scale bars: (A) 100 µm; (A’) 20 µm; (F) 1 mm; (H) 2.5 mm.

Acknowledgments
This image is the copyrighted work of the attributed author or publisher, and ZFIN has permission only to display this image to its users. Additional permissions should be obtained from the applicable author or publisher of the image. Full text @ Sci. Rep.