IMAGE

Figure 3

ID
ZDB-IMAGE-191230-277
Source
Figures for Marinović et al., 2019
Image
Figure Caption

Figure 3

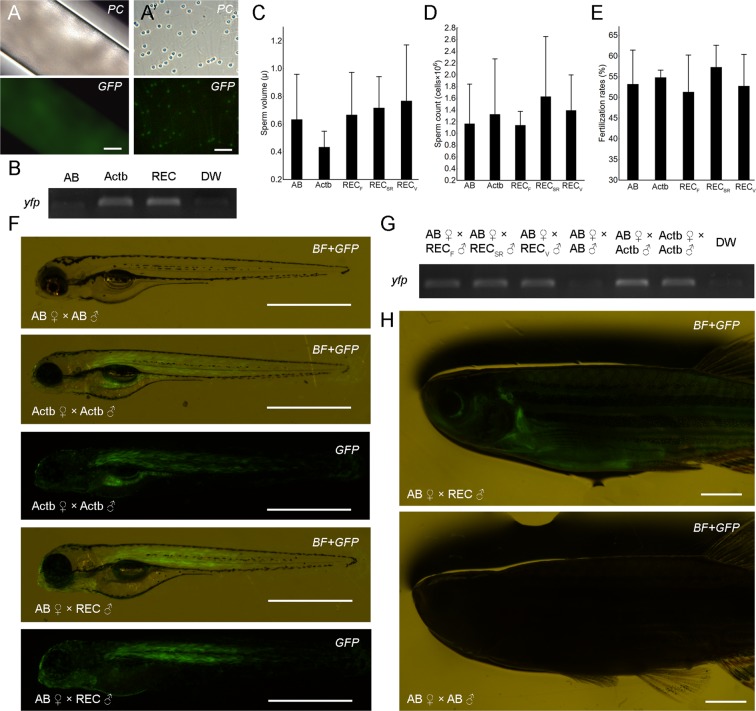
Production of donor-derived spermatozoa and progeny from MO-sterilized recipients. Milt (A) and individual spermatozoa (A’) stripped from recipients demonstrating yfp fluorescence. (B) RT-PCR amplification of yfp in milt obtained from wild-type AB (AB), β-actin transgenic (pku341Tg; Actb) and recipient (REC) zebrafish. Milt volume (C) and sperm count (D) of milt obtained from wild-type AB (AB), β-actin transgenic fish (pku341Tg; Actb) and recipients of fresh (RECF), frozen (RECSR) and vitrified (RECV) spermatogonia. (E) Fertilization rates after spawning control fish as well as recipient males and wild-type AB females. (F) Three dpf larvae obtained from crossing control fish and recipient males with wild-type AB females under fluorescent stereomicroscope. (G) PCR amplification of yfp in offspring obtained from control crossings, as well as from crossing recipient males with wild-type AB females. (H) F1 individuals developed normally and donor-derived individuals displayed fluorescent signal compared to the control crossing six months after fertilization. Values in CE are presented as mean ± SD. Lack of different letters above SD lines indicate the lack of statistical significance (Tukey’s HSD, p > 0.05). Scale bars: (A) 100 µm; (A’) 20 µm; (F) 1 mm; (H) 2.5 mm.

Acknowledgments
This image is the copyrighted work of the attributed author or publisher, and ZFIN has permission only to display this image to its users. Additional permissions should be obtained from the applicable author or publisher of the image. Full text @ Sci. Rep.