
- Title
-
A novel conserved enhancer at zebrafish zic3 and zic6 loci drives neural expression
- Authors
- Minhas, R., Paterek, A., Łapiński, M., Bazała, M., Korzh, V., Winata, C.L.
- Source
- Full text @ Dev. Dyn.
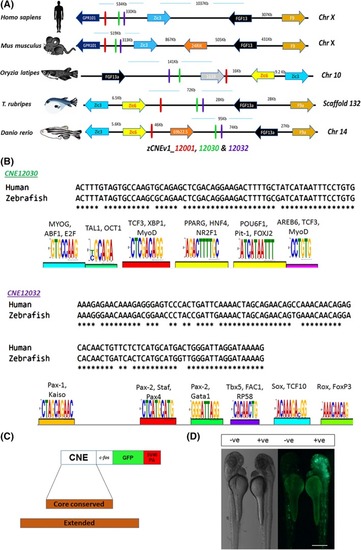
A, Comparative syntenic analysis of human, mouse, medaka, fugu, and zebrafish orthologous loci, depicting the conserved presence of two genes, |
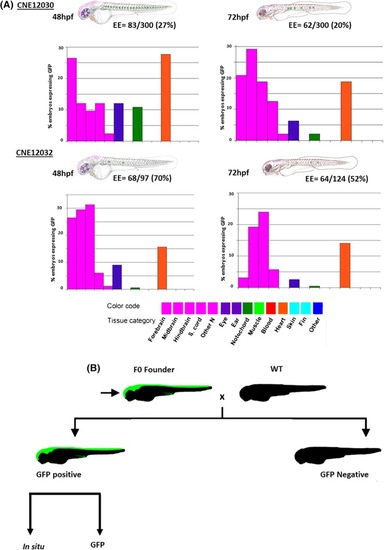
Sites of GFP signals that were recorded in zebrafish embryos that were transiently transfected with a full‐length construct. The reporter genes that were induced by individual CNEs (indicated by the name) are depicted in schematic representations of day 2 (48 hpf) or day 3 (72 hpf) embryos. Categories of a cell type that was positive for a given element are color‐coded, with a GFP‐expressing cell. The bar graphs ( |
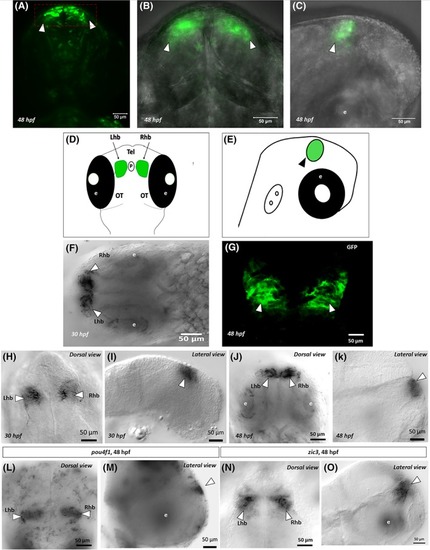
Green fluorescent protein expression in stable F1 line at 48 hpf. A, Green fluorescent protein expression in live embryos is indicated by arrowheads in the left and right habenula. B, The same GFP expression from the same embryo in a closer view. C, Green fluorescent protein expression from the lateral side. D and E, Schematics that show GFP expression in the habenula at 48 hpf in the dorsal and lateral views. F, RNA whole‐mount in situ hybridization using a probe against GFP, confirming its expression in the habenula at 30 hpf. G, Whole‐mount anti‐GFP immunohistochemistry, confirming GFP expression in the habenula at 48 hpf. H‐K, RNA whole‐mount in situ hybridization against GFP, showing GFP expression in the habenula at 30 hpf (H, I) and 48 hpf (J, K). L and M, RNA whole‐mount in situ hybridization using |
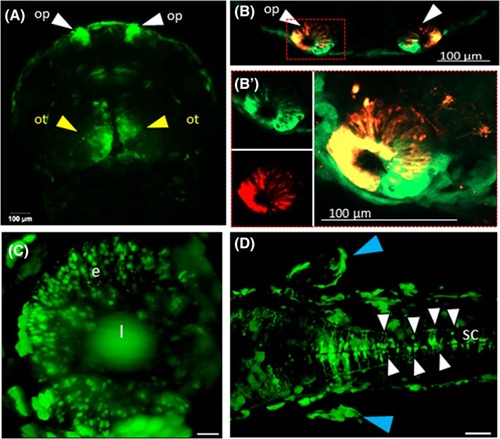
Robust expression pattern driven by CNE12032. Live fluorescent images of CNE12032 stable transgenic zebrafish embryo on day 2. Green‐fluorescent protein‐expressing regions in live embryos are shown, indicated by arrowheads. A, Confocal Z‐stack images of the dorsal view. The white arrowhead indicates GFP‐expressing cells in the olfactory pit. The yellow arrows show the optic tectum. B, Merged channel, highlighting colocalized DiI with EGFP in olfactory sensory neurons. B′, DiI fluorescence in olfactory neurons in the same embryo in a closer view. C, Light‐sheet Z‐stack images in the lateral view, anterior to the left. The white arrow indicates GFP signals in the eye. D, Light‐sheet Z‐stack images in the dorsal view, anterior to the left. The white arrowheads indicate GFP signals in the spinal cord. The blue arrowheads indicate GFP signals in the pectoral fin. Scale bars = 20 μm in (C) and 50 μm in (D). CNE, conserved noncoding element; e, eye; EGFP, enhanced green fluorescent protein; GFP, green fluorescent protein; l, lens; op, olfactory pit; ot, optic tectum; pf, pectoral fin; sc, spinal cord |